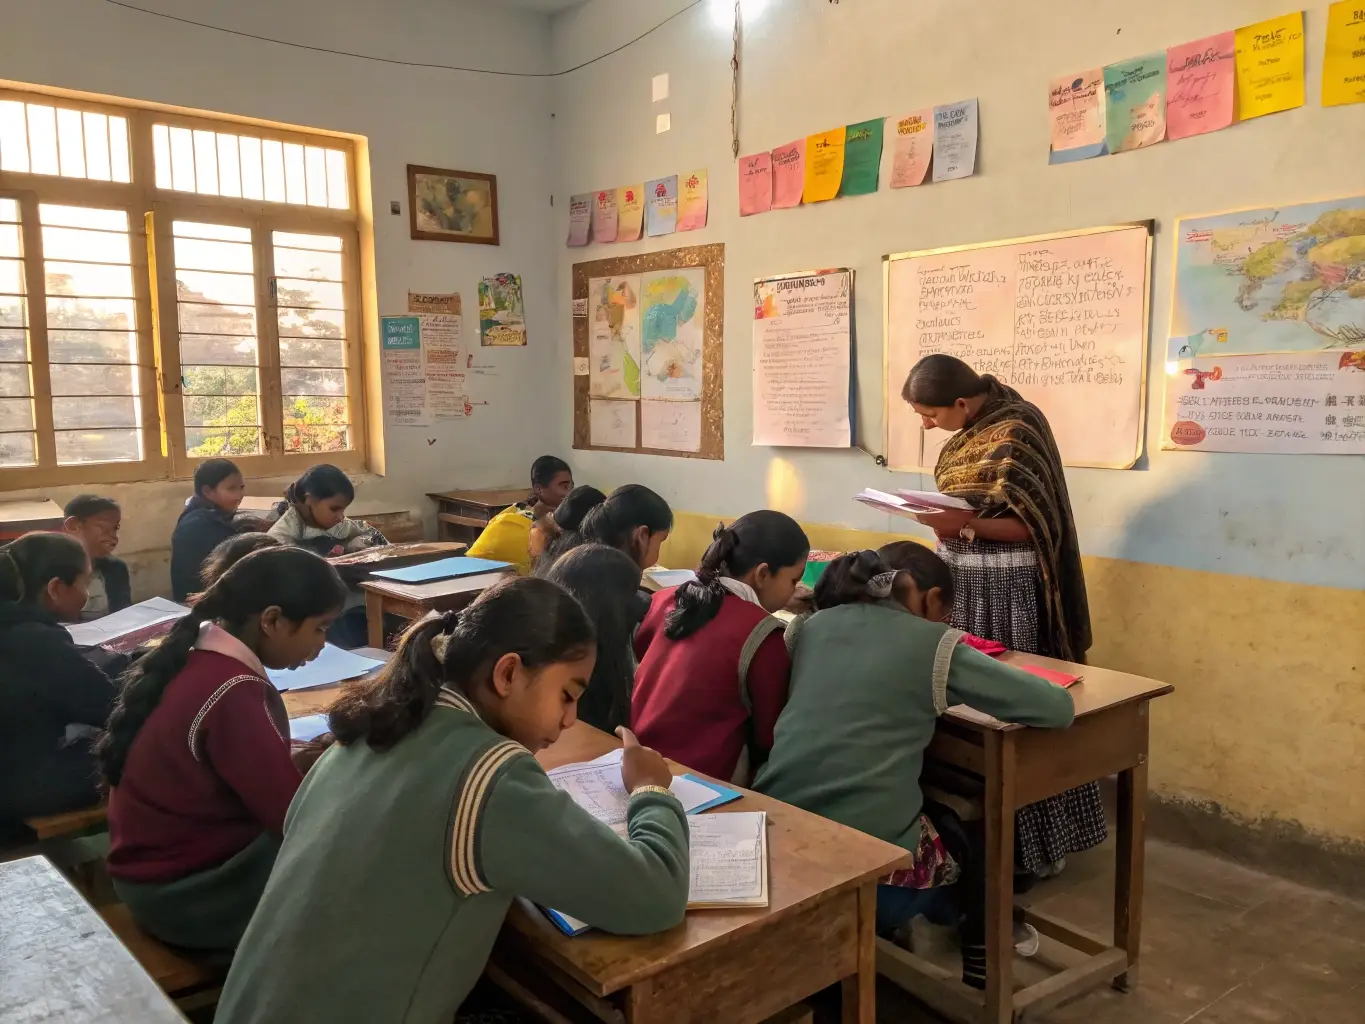
A quick summary of Class 2 Maths Chapter 11 — collecting and recording simple data using tally marks, a child’s first step into data handling.
Last Updated: September 23, 2026
Class 2 Maths Chapter 11 Revision Notes: Data Handling
Chapter type: Data handling — introduction to tally marks and simple data comparison.
Key ideas to remember
Tally mark — a single stroke recording one count; every fifth mark crosses the previous four (drawn as a diagonal line across four vertical strokes) for easy counting in fives.
Collecting data — asking a question (like “which fruit does each classmate like best?”) and recording each response as one tally mark in the right group.
Reading tally marks — counting completed groups of five first, then adding any leftover single strokes, to find the total quickly.
Most/least — comparing tally totals across different groups to find which option was chosen most often and which least often.
Simple pictographs — using one picture or symbol to represent one item of data, as another easy way (besides tally marks) to show and compare counts.
Worked Example
Example: A class of 20 students was asked their favourite fruit. The tally results were: Mango – 8, Apple – 5, Banana – 4, Orange – 3. Which fruit is the most popular, and how many more students chose it over the least popular fruit?
Solution: Mango is the most popular (8 tallies). Orange is the least popular (3 tallies). Difference = 8 − 3 = 5 students.
What you should be able to do after this chapter
1. Record a count using tally marks correctly (grouping every fifth mark).
2. Read a set of tally marks to find the total count.
3. Compare tally totals to say which option is the most or least common.
4. Represent a small set of counted data using a simple picture-based chart.
Quick Recap
- A single tally mark = 1 count.
- Every 5th tally mark is drawn crossing the previous four, making a group of 5.
- To read a tally total: count the crossed groups of 5 first, then add leftover single marks.
- “Most” = the group with the highest tally total; “least” = the group with the lowest.
Tally Marks and Pictographs Compared
Tally marks are quick to draw while collecting data on the spot (one stroke per response). A pictograph, by contrast, uses one small picture or symbol to represent each unit of data and is usually drawn afterwards to present the collected totals in a way that’s easy to compare at a glance. Both answer the same kinds of questions — “which is most?”, “which is least?”, “how many more?” — using different-looking pictures of the same counted information.
Steps to Collect Your Own Data
1. Decide on a clear question with a few possible answers (e.g. “favourite season: summer, winter, monsoon”).
2. Ask each person the question, one at a time.
3. Draw one tally mark for each response, in the correct group.
4. Cross every fifth mark to make counting easier later.
5. Once everyone has answered, count the totals and compare.
Remember
Counting tally marks in groups of five (rather than one at a time) is much faster and less error-prone — always look for the crossed groups of five first, then add any leftover single strokes. For example, 3 crossed groups plus 2 extra strokes = (3 × 5) + 2 = 17.
Practice Questions
1. If a tally shows 4 crossed groups and 1 extra stroke, what is the total?
2. Why is a tally mark grouped in fives instead of, say, threes or tens?
3. Name one everyday question you could ask your classmates and collect tally-mark data for.
Answers: 1. (4 × 5) + 1 = 21 2. Groups of five are easy to count at a glance and quick to draw (four strokes plus one crossing stroke), striking a good balance between speed and readability 3. Answers vary — e.g. “What is your favourite colour/sport/season?”
- Chapter 1: A Day at the Beach – Free PDF Download
- Chapter 2: Shapes Around Us – Free PDF Download
- Chapter 3: Fun with Numbers – Free PDF Download
- Chapter 4: Shadow Story (Togalu) – Free PDF Download
- Chapter 5: Playing with Lines – Free PDF Download
- Chapter 6: Decoration for Festival – Free PDF Download
- Chapter 7: Rani's Gift – Free PDF Download
- Chapter 8: Grouping and Sharing – Free PDF Download
- Chapter 9: Which Season is it? – Free PDF Download
- Chapter 10: Fun at the Fair – Free PDF Download
Frequently Asked Questions
Is data handling only about tally marks?
In this chapter, yes — tally marks and simple picture data are the two ways data is recorded and read; graphs and charts with axes come in later classes.
How does this chapter connect to later classes?
It is the earliest step toward pictographs and bar graphs, which appear in Class 3 and beyond, using the exact same idea of counting and comparing grouped data.
Why do we cross the fifth tally mark instead of drawing it separately?
The crossed group of five is easier to spot and count quickly at a glance than counting five separate straight lines one by one, especially when there are many groups to add up.
Can tally marks be used for any kind of question, or only some?
They work best for questions with a small, fixed set of possible answers (like favourite fruit, colour, or pet) where every response can be sorted cleanly into one group — open-ended answers that don’t fit neat categories are harder to tally.
What real activity at home can help a child practise this chapter?
Ask family members or neighbours a simple question (favourite meal, favourite game) and have the child record each answer with a tally mark, then read out the final “most popular” and “least popular” answer from their own collected data.
Recommended: Buy the Printed NCERT Class 2 Maths Book
Contains Amazon affiliate links.
If you’d like a printed copy alongside the PDF, here’s a verified option:
Check the latest price on Amazon
Price and availability may change on Amazon. As an Amazon Associate, ncertbooks.org earns from qualifying purchases.