Statistics is the branch of mathematics that deals with collecting, organising, analysing and interpreting numerical data. In earlier classes we studied measures of central tendency — mean, median and mode — which give a single representative value for a data set. However, two data sets can have the same mean or median and yet be very differently spread out. Class 11 Maths Chapter 13, Statistics, introduces measures of dispersion — range, mean deviation, variance and standard deviation — which tell us how scattered the observations are about a measure of central tendency. This page provides complete, step-by-step NCERT solutions for every exercise in the chapter, solved directly from the current NCERT textbook. These solutions cover mean deviation (about mean and median) for ungrouped and grouped data, and variance and standard deviation (direct and shortcut methods), exactly as per the latest rationalised NCERT syllabus.
Last Updated: September 23, 2026
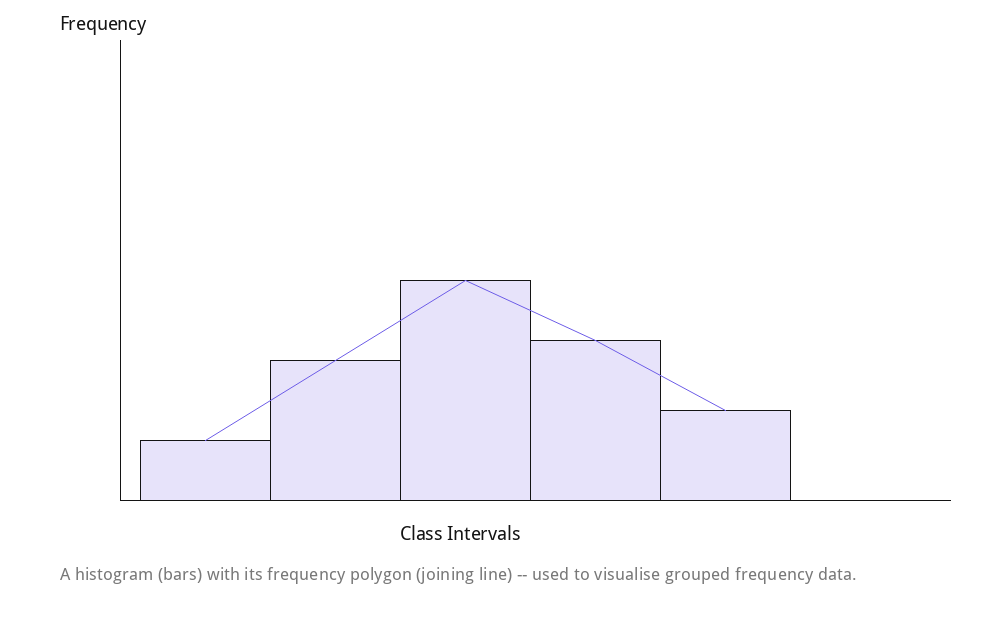 Reference figure: a histogram of grouped data, illustrating how frequency-distribution data used throughout this chapter is visualised.
Exercise 13.1
Q1. Find the mean deviation about the mean for the data: 4, 7, 8, 9, 10, 12, 13, 17 — Number of observations, n = 8. Mean, x̄ = (4 + 7 + 8 + 9 + 10 + 12 + 13 + 17)/8 = 80/8…
Number of observations, n = 8.
Mean, x̄ = (4 + 7 + 8 + 9 + 10 + 12 + 13 + 17)/8 = 80/8 = 10.
Absolute deviations |xᵢ − x̄|: 6, 3, 2, 1, 0, 2, 3, 7.
Sum of absolute deviations = 6 + 3 + 2 + 1 + 0 + 2 + 3 + 7 = 24.
Mean deviation about mean, M.D.(x̄) = 24/8 = 3.
Q2. Find the mean deviation about the mean for the data: 38, 70, 48, 40, 42, 55, 63, 46, 54, 44 — Number of observations, n = 10. Mean, x̄ = (38+70+48+40+42+55+63+46+54+44)/10 = 500/10…
Number of observations, n = 10.
Mean, x̄ = (38+70+48+40+42+55+63+46+54+44)/10 = 500/10 = 50.
Absolute deviations |xᵢ − x̄|: 12, 20, 2, 10, 8, 5, 13, 4, 4, 6.
Sum of absolute deviations = 12+20+2+10+8+5+13+4+4+6 = 84.
Mean deviation about mean, M.D.(x̄) = 84/10 = 8.4.
Q3. Find the mean deviation about the median for the data: 13, 17, 16, 14, 11, 13, 10, 16, 11, 18, 12, 17 — Number of observations, n = 12. Arranging in ascending order: 10, 11, 11, 12, 13, 13,…
Number of observations, n = 12. Arranging in ascending order:
10, 11, 11, 12, 13, 13, 14, 16, 16, 17, 17, 18.
Since n is even, Median = mean of 6th and 7th observations = (13 + 14)/2 = 13.5.
Absolute deviations |xᵢ − M|: 3.5, 2.5, 2.5, 1.5, 0.5, 0.5, 0.5, 2.5, 2.5, 3.5, 3.5, 4.5.
Sum of absolute deviations = 28.
Mean deviation about median, M.D.(M) = 28/12 = 2.33 (approx).
Q4. Find the mean deviation about the median for the data: 36, 72, 46, 42, 60, 45, 53, 46, 51, 49 — Number of observations, n = 10. Arranging in ascending order: 36, 42, 45, 46, 46, 49,…
Number of observations, n = 10. Arranging in ascending order:
36, 42, 45, 46, 46, 49, 51, 53, 60, 72.
Since n is even, Median = mean of 5th and 6th observations = (46 + 49)/2 = 47.5.
Absolute deviations |xᵢ − M|: 11.5, 5.5, 2.5, 1.5, 1.5, 1.5, 3.5, 5.5, 12.5, 24.5.
Sum of absolute deviations = 70.
Mean deviation about median, M.D.(M) = 70/10 = 7.
Q5. Find the mean deviation about the mean for the data:
| xᵢ | 5 | 10 | 15 | 20 | 25 |
|---|---|---|---|---|---|
| fᵢ | 7 | 4 | 6 | 3 | 5 |
N = Σfᵢ = 7+4+6+3+5 = 25.
Σfᵢxᵢ = 5(7)+10(4)+15(6)+20(3)+25(5) = 35+40+90+60+125 = 350.
Mean, x̄ = 350/25 = 14.
Σfᵢ|xᵢ − x̄| = 7(9)+4(4)+6(1)+3(6)+5(11) = 63+16+6+18+55 = 158.
Mean deviation about mean, M.D.(x̄) = 158/25 = 6.32.
Q6. Find the mean deviation about the mean for the data:
| xᵢ | 10 | 30 | 50 | 70 | 90 |
|---|---|---|---|---|---|
| fᵢ | 4 | 24 | 28 | 16 | 8 |
N = Σfᵢ = 4+24+28+16+8 = 80.
Σfᵢxᵢ = 10(4)+30(24)+50(28)+70(16)+90(8) = 40+720+1400+1120+720 = 4000.
Mean, x̄ = 4000/80 = 50.
Σfᵢ|xᵢ − x̄| = 4(40)+24(20)+28(0)+16(20)+8(40) = 160+480+0+320+320 = 1280.
Mean deviation about mean, M.D.(x̄) = 1280/80 = 16.
Q7. Find the mean deviation about the median for the data:
| xᵢ | 5 | 7 | 9 | 10 | 12 | 15 |
|---|---|---|---|---|---|---|
| fᵢ | 8 | 6 | 2 | 2 | 2 | 6 |
N = Σfᵢ = 8+6+2+2+2+6 = 26. Cumulative frequencies: 8, 14, 16, 18, 20, 26.
N/2 = 13. The cumulative frequency just greater than 13 is 14, corresponding to xᵢ = 7. So both the 13th and 14th observations equal 7.
Median = 7.
Σfᵢ|xᵢ − M| = 8(2)+6(0)+2(2)+2(3)+2(5)+6(8) = 16+0+4+6+10+48 = 84.
Mean deviation about median, M.D.(M) = 84/26 = 3.23 (approx).
Q8. Find the mean deviation about the median for the data:
| xᵢ | 15 | 21 | 27 | 30 | 35 |
|---|---|---|---|---|---|
| fᵢ | 3 | 5 | 6 | 7 | 8 |
N = Σfᵢ = 3+5+6+7+8 = 29. Cumulative frequencies: 3, 8, 14, 21, 29.
(N+1)/2 = 15th observation. The cumulative frequency just greater than 14 is 21, corresponding to xᵢ = 30.
Median = 30.
Σfᵢ|xᵢ − M| = 3(15)+5(9)+6(3)+7(0)+8(5) = 45+45+18+0+40 = 148.
Mean deviation about median, M.D.(M) = 148/29 = 5.10 (approx).
Q9. Find the mean deviation about the mean for the data:
| Income per day (₹) | 0-100 | 100-200 | 200-300 | 300-400 | 400-500 | 500-600 | 600-700 | 700-800 |
|---|---|---|---|---|---|---|---|---|
| Number of persons | 4 | 8 | 9 | 10 | 7 | 5 | 4 | 3 |
N = Σfᵢ = 4+8+9+10+7+5+4+3 = 50. Mid-points xᵢ: 50, 150, 250, 350, 450, 550, 650, 750.
Σfᵢxᵢ = 200+1200+2250+3500+3150+2750+2600+2250 = 17900.
Mean, x̄ = 17900/50 = 358.
Σfᵢ|xᵢ − x̄| = 4(308)+8(208)+9(108)+10(8)+7(92)+5(192)+4(292)+3(392) = 1232+1664+972+80+644+960+1168+1176 = 7896.
Mean deviation about mean, M.D.(x̄) = 7896/50 = 157.92.
Q10. Find the mean deviation about the mean for the data:
| Height (cm) | 95-105 | 105-115 | 115-125 | 125-135 | 135-145 | 145-155 |
|---|---|---|---|---|---|---|
| Number of boys | 9 | 13 | 26 | 30 | 12 | 10 |
N = Σfᵢ = 9+13+26+30+12+10 = 100. Mid-points xᵢ: 100, 110, 120, 130, 140, 150.
Σfᵢxᵢ = 900+1430+3120+3900+1680+1500 = 12530.
Mean, x̄ = 12530/100 = 125.3.
Σfᵢ|xᵢ − x̄| = 9(25.3)+13(15.3)+26(5.3)+30(4.7)+12(14.7)+10(24.7) = 227.7+198.9+137.8+141+176.4+247 = 1128.8.
Mean deviation about mean, M.D.(x̄) = 1128.8/100 = 11.29 (approx).
Q11. Find the mean deviation about median for the following data:
| Marks | 0-10 | 10-20 | 20-30 | 30-40 | 40-50 | 50-60 |
|---|---|---|---|---|---|---|
| Number of girls | 6 | 8 | 14 | 16 | 4 | 2 |
N = Σfᵢ = 6+8+14+16+4+2 = 50. Cumulative frequencies: 6, 14, 28, 44, 48, 50.
N/2 = 25. The class 20-30 has cumulative frequency 28 (just greater than 25), so it is the median class: l = 20, C = 14, f = 14, h = 10.
Median = l + [(N/2 − C)/f] × h = 20 + [(25−14)/14] × 10 = 20 + 7.857 = 27.86 (approx).
Mid-points xᵢ: 5, 15, 25, 35, 45, 55.
Σfᵢ|xᵢ − M| = 6(22.86)+8(12.86)+14(2.86)+16(7.14)+4(17.14)+2(27.14) ≈ 137.14+102.86+40.0+114.29+68.57+54.29 = 517.14.
Mean deviation about median, M.D.(M) = 517.14/50 = 10.34 (approx).
Q12. Calculate the mean deviation about median age for the age distribution of 100 persons given below:
| Age (years) | 16-20 | 21-25 | 26-30 | 31-35 | 36-40 | 41-45 | 46-50 | 51-55 |
|---|---|---|---|---|---|---|---|---|
| Number | 5 | 6 | 12 | 14 | 26 | 12 | 16 | 9 |
Hint (as given in the book): Convert the given data into a continuous frequency distribution by subtracting 0.5 from the lower limit and adding 0.5 to the upper limit of each class interval, giving classes 15.5-20.5, 20.5-25.5, 25.5-30.5, 30.5-35.5, 35.5-40.5, 40.5-45.5, 45.5-50.5, 50.5-55.5.
N = Σfᵢ = 100. Cumulative frequencies: 5, 11, 23, 37, 63, 75, 91, 100.
N/2 = 50. The class 35.5-40.5 has cumulative frequency 63 (just greater than 50), so it is the median class: l = 35.5, C = 37, f = 26, h = 5.
Median = 35.5 + [(50−37)/26] × 5 = 35.5 + 2.5 = 38.
Mid-points xᵢ: 18, 23, 28, 33, 38, 43, 48, 53.
Σfᵢ|xᵢ − M| = 5(20)+6(15)+12(10)+14(5)+26(0)+12(5)+16(10)+9(15) = 100+90+120+70+0+60+160+135 = 735.
Mean deviation about median, M.D.(M) = 735/100 = 7.35.
Exercise 13.2
Q1. Find the mean and variance for the data: 6, 7, 10, 12, 13, 4, 8, 12 — n = 8. Mean, x̄ = (6+7+10+12+13+4+8+12)/8 = 72/8 = 9. Deviations (xᵢ − x̄): −3,…
n = 8. Mean, x̄ = (6+7+10+12+13+4+8+12)/8 = 72/8 = 9.
Deviations (xᵢ − x̄): −3, −2, 1, 3, 4, −5, −1, 3. Squares: 9, 4, 1, 9, 16, 25, 1, 9.
Σ(xᵢ − x̄)² = 9+4+1+9+16+25+1+9 = 74.
Variance, σ² = 74/8 = 9.25. Mean = 9.
Q2. Find the mean and variance for the data: First n natural numbers — The first n natural numbers are 1, 2, 3, …, n. Mean, x̄ = (1+2+…+n)/n =…
The first n natural numbers are 1, 2, 3, …, n.
Mean, x̄ = (1+2+…+n)/n = [n(n+1)/2]/n = (n+1)/2.
It is a standard result that Σxᵢ² = n(n+1)(2n+1)/6, so
Variance, σ² = (1/n)Σxᵢ² − x̄² = (n+1)(2n+1)/6 − (n+1)²/4 = (n+1)[2(2n+1) − 3(n+1)]/12 = (n+1)(n−1)/12.
Variance = (n² − 1)/12.
Q3. Find the mean and variance for the data: First 10 multiples of 3 — The first 10 multiples of 3 are: 3, 6, 9, 12, 15, 18, 21, 24, 27, 30, i.e., 3 times the…
The first 10 multiples of 3 are: 3, 6, 9, 12, 15, 18, 21, 24, 27, 30, i.e., 3 times the first 10 natural numbers.
Mean of first 10 natural numbers = (10+1)/2 = 5.5, so Mean, x̄ = 3 × 5.5 = 16.5.
Variance of first 10 natural numbers = (10² − 1)/12 = 99/12 = 8.25.
Since each observation is multiplied by 3, variance scales by 3² = 9.
Variance, σ² = 9 × 8.25 = 74.25.
Q4. Find the mean and variance for the data:
| xᵢ | 6 | 10 | 14 | 18 | 24 | 28 | 30 |
|---|---|---|---|---|---|---|---|
| fᵢ | 2 | 4 | 7 | 12 | 8 | 4 | 3 |
N = Σfᵢ = 2+4+7+12+8+4+3 = 40.
Σfᵢxᵢ = 12+40+98+216+192+112+90 = 760. Mean, x̄ = 760/40 = 19.
Σfᵢxᵢ² = 72+400+1372+3888+4608+3136+2700 = 16176.
Variance, σ² = (Σfᵢxᵢ²)/N − x̄² = 16176/40 − 19² = 404.4 − 361 = 43.4. Mean = 19.
Q5. Find the mean and variance for the data:
| xᵢ | 92 | 93 | 97 | 98 | 102 | 104 | 109 |
|---|---|---|---|---|---|---|---|
| fᵢ | 3 | 2 | 3 | 2 | 6 | 3 | 3 |
N = Σfᵢ = 3+2+3+2+6+3+3 = 22.
Σfᵢxᵢ = 276+186+291+196+612+312+327 = 2200. Mean, x̄ = 2200/22 = 100.
Σfᵢxᵢ² = 25392+17298+28227+19208+62424+32448+35643 = 220640.
Variance, σ² = 220640/22 − 100² = 10029.09 − 10000 = 29.09 (approx). Mean = 100.
Q6. Find the mean and standard deviation using short-cut method:
| xᵢ | 60 | 61 | 62 | 63 | 64 | 65 | 66 | 67 | 68 |
|---|---|---|---|---|---|---|---|---|---|
| fᵢ | 2 | 1 | 12 | 29 | 25 | 12 | 10 | 4 | 5 |
N = Σfᵢ = 100. Let assumed mean A = 64 and h = 1, so dᵢ = xᵢ − 64: −4, −3, −2, −1, 0, 1, 2, 3, 4.
Σfᵢdᵢ = −8−3−24−29+0+12+20+12+20 = 0. Mean, x̄ = A + (Σfᵢdᵢ)/N = 64 + 0 = 64.
Σfᵢdᵢ² = 32+9+48+29+0+12+40+36+80 = 286.
Variance, σ² = (h²/N²)[N·Σfᵢdᵢ² − (Σfᵢdᵢ)²] = (1/10000)[100×286 − 0] = 28600/10000 = 2.86.
Standard deviation, σ = √2.86 = 1.69 (approx).
Q7. Find the mean and variance for the following frequency distribution:
| Classes | 0-30 | 30-60 | 60-90 | 90-120 | 120-150 | 150-180 | 180-210 |
|---|---|---|---|---|---|---|---|
| Frequencies | 2 | 3 | 5 | 10 | 3 | 5 | 2 |
N = Σfᵢ = 30. Mid-points xᵢ: 15, 45, 75, 105, 135, 165, 195. Let A = 105, h = 30, dᵢ = (xᵢ − A)/h: −3, −2, −1, 0, 1, 2, 3.
Σfᵢdᵢ = −6−6−5+0+3+10+6 = 2. Mean, x̄ = A + (Σfᵢdᵢ/N)×h = 105 + (2/30)×30 = 107.
Σfᵢdᵢ² = 18+12+5+0+3+20+18 = 76.
Variance, σ² = (h²/N²)[N·Σfᵢdᵢ² − (Σfᵢdᵢ)²] = (900/900)[30×76 − 4] = 2280 − 4 = 2276.
Q8. Find the mean and variance for the following frequency distribution:
| Classes | 0-10 | 10-20 | 20-30 | 30-40 | 40-50 |
|---|---|---|---|---|---|
| Frequencies | 5 | 8 | 15 | 16 | 6 |
N = Σfᵢ = 50. Mid-points xᵢ: 5, 15, 25, 35, 45. Let A = 25, h = 10, dᵢ = (xᵢ − A)/h: −2, −1, 0, 1, 2.
Σfᵢdᵢ = −10−8+0+16+12 = 10. Mean, x̄ = 25 + (10/50)×10 = 27.
Σfᵢdᵢ² = 20+8+0+16+24 = 68.
Variance, σ² = (h²/N²)[N·Σfᵢdᵢ² − (Σfᵢdᵢ)²] = (100/2500)[50×68 − 100] = 0.04×3300 = 132.
Q9. Find the mean, variance and standard deviation using the short-cut method:
| Height (cm) | 70-75 | 75-80 | 80-85 | 85-90 | 90-95 | 95-100 | 100-105 | 105-110 | 110-115 |
|---|---|---|---|---|---|---|---|---|---|
| No. of children | 3 | 4 | 7 | 7 | 15 | 9 | 6 | 6 | 3 |
N = Σfᵢ = 60. Mid-points xᵢ: 72.5, 77.5, 82.5, 87.5, 92.5, 97.5, 102.5, 107.5, 112.5. Let A = 92.5, h = 5, dᵢ = (xᵢ − A)/h: −4, −3, −2, −1, 0, 1, 2, 3, 4.
Σfᵢdᵢ = −12−12−14−7+0+9+12+18+12 = 6. Mean, x̄ = 92.5 + (6/60)×5 = 92.5 + 0.5 = 93.
Σfᵢdᵢ² = 48+36+28+7+0+9+24+54+48 = 254.
Variance, σ² = (h²/N²)[N·Σfᵢdᵢ² − (Σfᵢdᵢ)²] = (25/3600)[60×254 − 36] = (25/3600)×15204 = 105.58 (approx).
Standard deviation, σ = √105.58 = 10.27 (approx).
Q10. The diameters of circles (in mm) drawn in a design are given below. Calculate the standard deviation and mean diameter of the circles.
| Diameters | 33-36 | 37-40 | 41-44 | 45-48 | 49-52 |
|---|---|---|---|---|---|
| No. of circles | 15 | 17 | 21 | 22 | 25 |
Hint (as given in the book): First make the data continuous by writing the classes as 32.5-36.5, 36.5-40.5, 40.5-44.5, 44.5-48.5, 48.5-52.5, and then proceed.
N = Σfᵢ = 100. Mid-points xᵢ: 34.5, 38.5, 42.5, 46.5, 50.5. Let A = 42.5, h = 4, dᵢ = (xᵢ − A)/h: −2, −1, 0, 1, 2.
Σfᵢdᵢ = −30−17+0+22+50 = 25. Mean, x̄ = 42.5 + (25/100)×4 = 42.5 + 1 = 43.5.
Σfᵢdᵢ² = 60+17+0+22+100 = 199.
Variance, σ² = (h²/N²)[N·Σfᵢdᵢ² − (Σfᵢdᵢ)²] = (16/10000)[100×199 − 625] = (16/10000)×19275 = 30.84.
Standard deviation, σ = √30.84 = 5.55 (approx). Mean diameter = 43.5 mm.
Miscellaneous Exercise
Q1. The mean and variance of eight observations are 9 and 9.25, respectively. If six of the observations are 6, 7, 10, 12, 12 and 13, find the remaining two observations — Let the remaining two observations be x and y. Given n = 8, mean = 9, variance = 9.25.…
Let the remaining two observations be x and y. Given n = 8, mean = 9, variance = 9.25.
Sum of all 8 observations = 9 × 8 = 72. Sum of known six = 6+7+10+12+12+13 = 60, so x + y = 72 − 60 = 12.
Σxᵢ² = n(variance + mean²) = 8(9.25 + 81) = 8 × 90.25 = 722.
Sum of squares of known six = 36+49+100+144+144+169 = 642, so x² + y² = 722 − 642 = 80.
Now (x+y)² = x²+y²+2xy ⟹ 144 = 80 + 2xy ⟹ xy = 32.
So x and y are roots of t² − 12t + 32 = 0 ⟹ (t − 8)(t − 4) = 0 ⟹ t = 8 or 4.
The remaining two observations are 4 and 8.
Q2. The mean and variance of 7 observations are 8 and 16, respectively. If five of the observations are 2, 4, 10, 12, 14, find the remaining two observations — Let the remaining two observations be x and y. Given n = 7, mean = 8, variance = 16. Sum…
Let the remaining two observations be x and y. Given n = 7, mean = 8, variance = 16.
Sum of all 7 observations = 8 × 7 = 56. Sum of known five = 2+4+10+12+14 = 42, so x + y = 56 − 42 = 14.
Σxᵢ² = n(variance + mean²) = 7(16 + 64) = 7 × 80 = 560.
Sum of squares of known five = 4+16+100+144+196 = 460, so x² + y² = 560 − 460 = 100.
Now (x+y)² = x²+y²+2xy ⟹ 196 = 100 + 2xy ⟹ xy = 48.
So x and y are roots of t² − 14t + 48 = 0 ⟹ (t − 8)(t − 6) = 0 ⟹ t = 8 or 6.
The remaining two observations are 6 and 8.
Q3. The mean and standard deviation of six observations are 8 and 4, respectively. If each observation is multiplied by 3, find the new mean and new standard deviation of the resulting observations — When each observation is multiplied by a constant a, the new mean becomes a times the…
When each observation is multiplied by a constant a, the new mean becomes a times the old mean, and the new standard deviation becomes |a| times the old standard deviation.
New mean = 3 × 8 = 24.
New standard deviation = 3 × 4 = 12.
Q4. Given that x̄ is the mean and σ² is the variance of n observations x₁, x₂, …, xₙ. Prove that the mean and variance of the observations ax₁, ax₂, ax₃, …, axₙ are a x̄ and a²σ², respectively (a ≠ 0) — Let yᵢ = axᵢ for i = 1, 2, …, n. Mean of yᵢ, ȳ = (1/n)Σyᵢ = (1/n)Σ(axᵢ)…
Let yᵢ = axᵢ for i = 1, 2, …, n.
Mean of yᵢ, ȳ = (1/n)Σyᵢ = (1/n)Σ(axᵢ) = a × (1/n)Σxᵢ = a x̄.
Variance of yᵢ, σᵧ² = (1/n)Σ(yᵢ − ȳ)² = (1/n)Σ(axᵢ − a x̄)² = (1/n)Σa²(xᵢ − x̄)² = a² × (1/n)Σ(xᵢ − x̄)² = a²σ².
Hence proved that the mean and variance of ax₁, ax₂, …, axₙ are a x̄ and a²σ² respectively.
Q5. The mean and standard deviation of 20 observations are found to be 10 and 2, respectively. On rechecking, it was found that an observation 8 was incorrect. Calculate the correct mean and standard deviation in each of the following cases:
- If the wrong item is omitted.
Original sum = 10 × 20 = 200. Original Σxᵢ² = n(variance + mean²) = 20(4 + 100) = 2080.
After omitting 8: new n = 19, new sum = 200 − 8 = 192, so new mean = 192/19 = 10.11 (approx).
New Σxᵢ² = 2080 − 64 = 2016.
New variance = 2016/19 − (192/19)² = 106.11 − 102.12 = 3.99 (approx).
New standard deviation = √3.99 ≈ 2.00. - If it is replaced by 12.
New sum = 200 − 8 + 12 = 204 (n remains 20), so new mean = 204/20 = 10.2.
New Σxᵢ² = 2080 − 64 + 144 = 2160.
New variance = 2160/20 − (10.2)² = 108 − 104.04 = 3.96.
New standard deviation = √3.96 ≈ 1.99.
Q6. The mean and standard deviation of a group of 100 observations were found to be 20 and 3, respectively. Later on it was found that three observations were incorrect, which were recorded as 21, 21 and 18. Find the mean and standard deviation if the incorrect observations are omitted — Original sum = 20 × 100 = 2000. Original Σxᵢ² = n(variance + mean²) = 100(9 + 400)…
Original sum = 20 × 100 = 2000. Original Σxᵢ² = n(variance + mean²) = 100(9 + 400) = 40900.
After omitting the three incorrect observations (21, 21, 18): new n = 97, new sum = 2000 − 21 − 21 − 18 = 1940, so new mean = 1940/97 = 20.
New Σxᵢ² = 40900 − (21² + 21² + 18²) = 40900 − (441+441+324) = 40900 − 1206 = 39694.
New variance = 39694/97 − 20² = 409.22 − 400 = 9.22 (approx).
New standard deviation = √9.22 ≈ 3.04.
Class 11 Maths Chapter 13 – Notes and Extra Questions
- Range = Maximum value − Minimum value; it gives only a rough idea of dispersion since it depends only on the two extreme values.
- Mean deviation is the average of the absolute deviations of observations from a central value (mean or median); absolute values are used because the algebraic sum of deviations from the mean is always zero.
- For ungrouped data, M.D.(x̄) = (1/n)Σ|xᵢ − x̄|; for discrete/continuous grouped data, M.D.(x̄) = (1/N)Σfᵢ|xᵢ − x̄|, where N = Σfᵢ.
- For the median, observations must first be arranged in order; the median class for grouped data is located using cumulative frequency and N/2.
- Variance, σ², is the mean of the squares of the deviations from the mean: σ² = (1/n)Σ(xᵢ − x̄)² for ungrouped data, and σ² = (1/N)Σfᵢ(xᵢ − x̄)² for grouped data.
- Standard deviation, σ = √(variance), is the positive square root of the variance and is expressed in the same units as the data.
- Shortcut (step-deviation) method: with assumed mean A and class width h, dᵢ = (xᵢ − A)/h, and variance σ² = (h²/N²)[N·Σfᵢdᵢ² − (Σfᵢdᵢ)²].
- If every observation is multiplied by a constant a, the new mean is a times the old mean and the new variance is a² times the old variance (new SD is |a| times the old SD); adding a constant to every observation does not change the variance or SD.
- Extra practice: Find the mean deviation about the mean for the data 10, 12, 14, 16, 18, 20 and verify it against the mean deviation about the median.
- Extra practice: Calculate the variance and standard deviation of the first 15 natural numbers using the direct formula.
- Extra practice: For a grouped frequency distribution with classes of width 10, use the step-deviation method to compute variance and compare the result with the direct method.
- Chapter 1: Sets (2026-27)
- Chapter 2: Relations and Functions – Free PDF Download
- Chapter 3: Trigonometric Functions – Free PDF Download
- Chapter 4: Complex Numbers and Quadratic Equations – Free PDF Download
- Chapter 5: Linear Inequalities – Free PDF Download
- Chapter 6: Permutations and Combinations – Free PDF Download
- Chapter 7: Binomial Theorem – Free PDF Download
- Chapter 8: Sequences and Series – Free PDF Download
- Chapter 9: Straight Lines – Free PDF Download
- Chapter 10: Conic Sections – Free PDF Download
- Chapter 11: Introduction to Three Dimensional Geometry – Free PDF Download
- Chapter 12: Limits and Derivatives – Free PDF Download
- Chapter 14: Probability – Free PDF Download
Frequently Asked Questions
Q1. What is the difference between mean deviation and standard deviation? — Mean deviation uses the absolute values of deviations from a measure of central tendency…
Mean deviation uses the absolute values of deviations from a measure of central tendency (mean or median), while standard deviation uses the square root of the average of the squared deviations from the mean. Standard deviation is more commonly used because it is amenable to further algebraic treatment, whereas mean deviation, based on absolute values, is not.
Q2. Why do we take the absolute value or square the deviations while calculating mean deviation and variance? — Because the sum of deviations of observations from their mean is always zero (positive…
Because the sum of deviations of observations from their mean is always zero (positive and negative deviations cancel out), simply averaging the deviations would always give zero. Taking absolute values (for mean deviation) or squaring the deviations (for variance) prevents this cancellation and gives a meaningful, non-zero measure of dispersion.
Q3. How is the median class located for finding mean deviation about the median in grouped data? — First, find N = Σfᵢ and compute N/2. Then find the cumulative frequency just greater…
First, find N = Σfᵢ and compute N/2. Then find the cumulative frequency just greater than or equal to N/2; the class corresponding to this cumulative frequency is the median class. The median is then calculated using Median = l + [(N/2 − C)/f] × h, where l is the lower limit, C is the cumulative frequency before the median class, f is the frequency of the median class, and h is the class width.
Q4. What happens to the mean, variance and standard deviation if every observation is multiplied by a constant or increased by a constant? — If every observation is multiplied by a constant a, the new mean becomes a times the old…
If every observation is multiplied by a constant a, the new mean becomes a times the old mean, and the new variance becomes a² times the old variance (so the new standard deviation is |a| times the old standard deviation). If a constant is added to every observation, the mean increases by that constant, but the variance and standard deviation remain unchanged, since deviations from the mean are unaffected by a constant shift.
Recommended: Buy the Printed NCERT Class 11 Maths Book
Contains Amazon affiliate links.
If you’d like a printed copy alongside the PDF, here’s a verified option:
4.2 out of 5 stars (953 ratings) · Rs. 170
Price and availability may change on Amazon. As an Amazon Associate, ncertbooks.org earns from qualifying purchases.