
Motion in a Straight Line is the first kinematics chapter of Class 11 Physics and lays the foundation for every motion topic that follows, from Motion in a Plane through Laws of Motion. It builds the core vocabulary of mechanics – displacement, velocity, acceleration, and the equations of uniformly accelerated motion – along with the skill of reading position-time and velocity-time graphs, both of which are heavily tested in CBSE board exams. Below are original, step-by-step solutions to all 18 in-chapter exercise questions (2.1-2.18) of the 2026-27 rationalised NCERT edition.
Last Updated: September 23, 2026
NCERT Solutions for Class 11 Physics Chapter 2: Motion in a Straight Line
Q2. 1: Point Objects – Railway Carriage, Monkey, Cricket Ball, Beaker — In which of the following examples of motion can the body be considered approximately a…
In which of the following examples of motion can the body be considered approximately a point object: (a) a railway carriage moving without jerks between two stations, (b) a monkey sitting on top of a man cycling smoothly on a circular track, (c) a spinning cricket ball that turns sharply on hitting the ground, (d) a tumbling beaker that has slipped off the edge of a table? A body can be treated as a point object only when the distance it travels is very large compared to its own size, so its size and internal motion become negligible. (a) The distance between the two stations is enormous compared to the length of the carriage, so it can be treated as a point object. (b) The circumference of the circular track is much larger than the size of the monkey and cycle, so the monkey can also be treated as a point object for this motion. (c) The sideways turn of the cricket ball on hitting the ground is comparable to the size of the ball itself, so it cannot be treated as a point object. (d) The height of the table (the distance through which the beaker falls and tumbles) is comparable to the size of the beaker, so it cannot be treated as a point object either. (a) and (b) can be treated as point objects; (c) and (d) cannot.
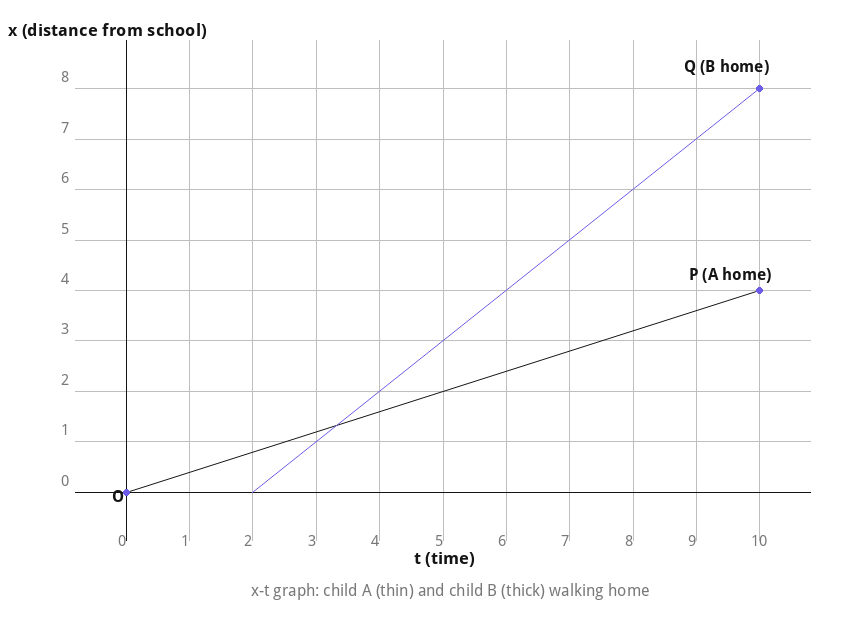
Q2. 2: Position-Time Graphs of Two Children Returning Home — The position-time (x-t) graphs for two children A and B, walking home from school O to…
The position-time (x-t) graphs for two children A and B, walking home from school O to their homes P and Q respectively, are given, with OP < OQ, and the two lines crossing each other once. (a) Since OP is shorter than OQ, A lives closer to the school than B. (b) A’s line starts from x = 0 at t = 0, while B’s line starts later, so A starts from school earlier than B. (c) B’s line has a steeper slope than A’s, and slope on an x-t graph gives speed, so B walks faster than A. (d) Both lines reach their final positions (P and Q) at the same value of t, so A and B reach home at the same time. (e) The two lines intersect exactly once before both reach home, so B overtakes A on the road once.
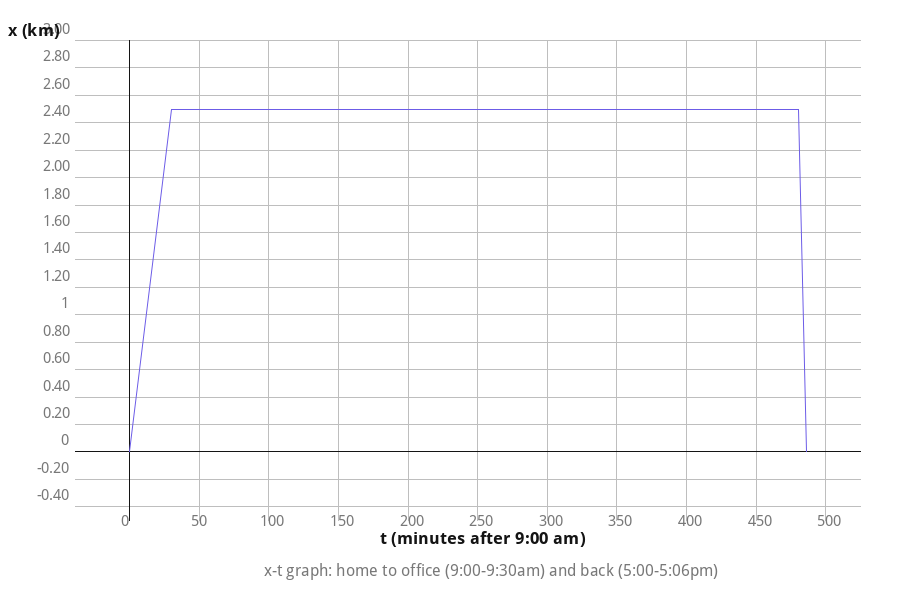
Q2. 3: Plotting the x-t Graph of a Woman's Trip to Office — A woman leaves home at 9:00 am, walks at 5 km h-1 to her office 2.5 km away, stays at…
A woman leaves home at 9:00 am, walks at 5 km h-1 to her office 2.5 km away, stays at the office until 5:00 pm, and returns home by auto at 25 km h-1. Choose suitable scales and plot the x-t graph of her motion. Time to walk to the office = distance ÷ speed = 2.5 km ÷ 5 km h-1 = 0.5 h = 30 minutes, so she reaches the office at 9:30 am. She then stays at the office (x = 2.5 km, unchanging) from 9:30 am to 5:00 pm. Time for the return auto trip = 2.5 km ÷ 25 km h-1 = 0.1 h = 6 minutes, so she is back home by 5:06 pm. Taking O as the origin for both distance and time (x = 0 at t = 9:00 am), the x-t graph is three straight-line segments: OA of slope +5 km h-1 from (9:00 am, 0) to (9:30 am, 2.5 km); AB, a horizontal line from (9:30 am, 2.5 km) to (5:00 pm, 2.5 km); and BC, a much steeper line of slope -25 km h-1 from (5:00 pm, 2.5 km) down to (5:06 pm, 0). She reaches the office at 9:30 am and returns home by 5:06 pm; the graph is the three-segment line OA-AB-BC described above.
Q2. 4: The Drunkard's Walk – Time to Fall into a Pit — A drunkard walking in a narrow lane takes 5 steps forward and 3 steps backward,…
A drunkard walking in a narrow lane takes 5 steps forward and 3 steps backward, repeatedly, with each step 1 m long and taking 1 s. How long does he take to fall into a pit 13 m away from the start? In each 8-second cycle (5 s forward, 3 s back), his net displacement is 5 m − 3 m = 2 m, but his exact position must be tracked second by second, since he may reach the pit mid-way through a forward run rather than only at the end of a full cycle. After cycle 1 (8 s): net position = 2 m. After cycle 2 (16 s): 4 m. After cycle 3 (24 s): 6 m. After cycle 4 (32 s): 8 m. In cycle 5, he then moves forward from 8 m, reaching 9 m, 10 m, 11 m, 12 m and 13 m on the 5th step of this cycle, i.e. at t = 32 s + 5 s = 37 s. The drunkard falls into the pit at t = 37 s.
Q2. 5: Retardation and Stopping Time of a Car — A car moving along a straight highway at 126 km h-1 is brought to a stop within a…
A car moving along a straight highway at 126 km h-1 is brought to a stop within a distance of 200 m. What is the retardation of the car (assumed uniform), and how long does it take to stop? Initial speed, u = 126 × 5/18 = 35 m s-1. Final speed, v = 0. Distance, s = 200 m. Using v² = u² + 2as: 0 = (35)² + 2a(200), so a = -1225/400 = -3.06 m s-2 (the negative sign indicates retardation). Using s = ½(u + v)t: 200 = ½(35 + 0)t, so t = 400/35 = 11.43 s. Retardation = 3.06 m s-2; the car takes 11.43 s to stop.
Q2. 6: Ball Thrown Upward – Velocity, Acceleration and Maximum Height — A player throws a ball upwards with an initial speed of 29.4 m s-1. (a) The only force…
A player throws a ball upwards with an initial speed of 29.4 m s-1. (a) The only force acting on the ball throughout its flight is gravity, so its acceleration is directed vertically downward at all times, even while it is still rising. (b) At the highest point, the ball’s velocity is momentarily zero, but its acceleration is still g = 9.8 m s-2, directed downward – it is never zero. (c) Taking the highest point as x = 0, t = 0, with the downward direction positive: during the upward motion (before the top), the ball is below the highest point, so x is positive and decreasing, meaning velocity is negative, while acceleration (g, downward) stays positive throughout. During the downward motion after the highest point, x increases from zero in the positive direction, so position, velocity and acceleration are all positive. (d) Time to rise: v = u − gt with v = 0, u = 29.4 m s-1, g = 9.8 m s-2: t = 29.4/9.8 = 3 s. Maximum height: v² = u² − 2gs with v = 0: s = (29.4)²/(2 × 9.8) = 864.36/19.6 = 44.1 m. By symmetry, the fall back down also takes 3 s, so the total time to return to the player’s hands is 3 + 3 = 6 s. The ball rises to a height of 44.1 m and returns to the player’s hands after 6 s.
Q2. 7: True or False – Statements on Speed and Acceleration — State with reasons whether each statement about a particle in one-dimensional motion is…
State with reasons whether each statement about a particle in one-dimensional motion is true or false. (a) With zero speed at an instant, it may have non-zero acceleration at that instant – true: a ball thrown straight up has zero speed at its highest point but its acceleration is still g = 9.8 m s-2 downward. (b) With zero speed, it may have non-zero velocity – false: speed is the magnitude of velocity, so zero speed forces velocity itself to be zero. (c) With constant speed, it must have zero acceleration – true: in 1-D motion, a real (finite) acceleration that keeps the speed strictly constant cannot allow a sudden reversal of direction, since that would require infinite (unphysical) acceleration; therefore any finite acceleration consistent with truly constant speed must be zero. (d) With a positive value of acceleration, it must be speeding up – false: whether the particle speeds up or slows down depends on whether acceleration is in the same direction as velocity or opposite to it; if velocity is negative while acceleration is positive, the particle is actually slowing down. (a) True, (b) False, (c) True, (d) False.
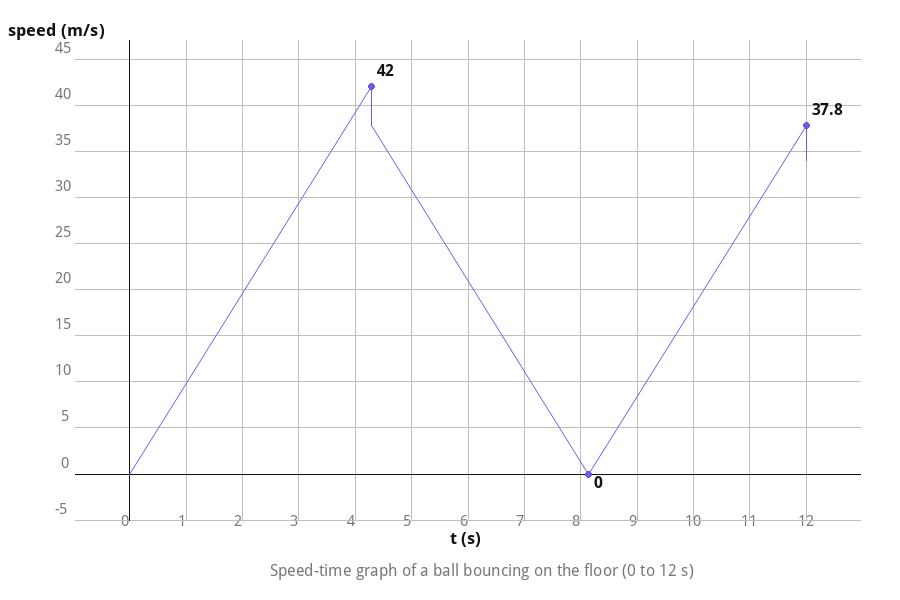
Q2. 8: Speed-Time Graph of a Bouncing Ball — A ball is dropped from a height of 90 m. At each collision with the floor it loses…
A ball is dropped from a height of 90 m. At each collision with the floor it loses one-tenth of its speed. Describe the speed-time graph of its motion between t = 0 and t = 12 s (take g = 9.8 m s-2). First fall: v² = u² + 2gh with u = 0, h = 90 m gives v² = 2 × 9.8 × 90 = 1764, so v = 42 m s-1 just before the first collision, reached at t = 42/9.8 = 4.29 s (speed rises linearly from 0 to 42 m s-1, since this is free fall). At this first collision, the ball loses one-tenth of its speed and rebounds at 0.9 × 42 = 37.8 m s-1. It then decelerates under gravity, its speed falling linearly from 37.8 m s-1 to 0 over a further 37.8/9.8 = 3.86 s (rebound peak at t = 4.29 + 3.86 = 8.14 s), then falls back the same height, speed rising linearly from 0 back up to 37.8 m s-1 over another 3.86 s, striking the floor again at t = 8.14 + 3.86 = 12.0 s – exactly at the edge of the given window. At this second collision its speed drops again to 0.9 × 37.8 = 34.02 m s-1. The speed-time graph is a repeating saw-tooth pattern: speed rises linearly from 0 to 42 m s-1 (0 to 4.29 s), drops instantly to 37.8 m s-1, falls linearly to 0 and rises linearly back to 37.8 m s-1 (4.29 s to 12 s), then drops instantly to 34.02 m s-1 at t = 12 s.
Q2. 9: Distance vs Displacement, Average Speed vs Average Velocity — Explain, with examples, the distinction between (a) the magnitude of displacement over…
Explain, with examples, the distinction between (a) the magnitude of displacement over an interval of time and the total path length covered over the same interval, and (b) the magnitude of average velocity and the average speed over the same interval, showing that the second quantity is always greater than or equal to the first. (a) Suppose a particle moves from point A to point B and then returns to A along the same path. Its displacement is zero, since it ends up where it started, but the total path length covered is AB + BA = 2AB, which is greater than zero – so path length ≥ magnitude of displacement. (b) If this journey takes time t, the magnitude of average velocity = displacement ÷ t = 0/t = 0, whereas the average speed = total path length ÷ t = 2AB/t, which is again the larger quantity. In both cases, equality holds only when the particle moves in a single, unchanging direction throughout the interval, because then the path length and the magnitude of displacement become identical. Path length ≥ magnitude of displacement, and average speed ≥ magnitude of average velocity, with equality only for one-directional, non-reversing motion.
Q2. 10: Average Velocity and Average Speed of a Man Walking to the Market — A man walks from home to a market 2.5 km away at 5 km h-1. Finding it closed, he…
A man walks from home to a market 2.5 km away at 5 km h-1. Finding it closed, he immediately turns back and walks home at 7.5 km h-1. Find the magnitude of average velocity and the average speed over (i) 0 to 30 min, (ii) 0 to 50 min, and (iii) 0 to 40 min. Time to reach the market = 2.5/5 = 0.5 h = 30 min. Time for the return walk = 2.5/7.5 = 1/3 h = 20 min, so he is back home at t = 50 min. (i) 0 to 30 min: he has walked 2.5 km to the market and not yet turned back, so both displacement and path length equal 2.5 km over 0.5 h. Average velocity = average speed = 2.5/0.5 = 5 km h-1 (both). (ii) 0 to 50 min: he is back at his starting point, so displacement = 0, giving average velocity = 0; the path length covered is 2.5 + 2.5 = 5 km over 5/6 h, so average speed = 5 ÷ (5/6) = 6 km h-1. (iii) 0 to 40 min: he reaches the market at t = 30 min, then walks back for a further 10 min (1/6 h) at 7.5 km h-1, covering 7.5 × 1/6 = 1.25 km, ending up 2.5 − 1.25 = 1.25 km from home. So displacement over 40 min = 1.25 km and path length = 2.5 + 1.25 = 3.75 km, over 2/3 h. Average velocity = 1.25 ÷ (2/3) = 1.875 km h-1; average speed = 3.75 ÷ (2/3) = 5.625 km h-1.
Q2. 11: Why Instantaneous Speed Equals the Magnitude of Instantaneous Velocity — Why is there no need to distinguish between average speed and average velocity when we…
Why is there no need to distinguish between average speed and average velocity when we consider instantaneous speed and instantaneous velocity? Instantaneous velocity is the limit of average velocity as the time interval Δt approaches zero. As Δt becomes vanishingly small, the actual path traced by the particle over that tiny interval becomes indistinguishable from a straight line, so the path length covered and the magnitude of the displacement become equal in that limit. Since instantaneous speed = (path length)/Δt and the magnitude of instantaneous velocity = (displacement)/Δt, and these two numerators become equal as Δt becomes infinitesimally small, the instantaneous speed is always exactly equal to the magnitude of the instantaneous velocity.
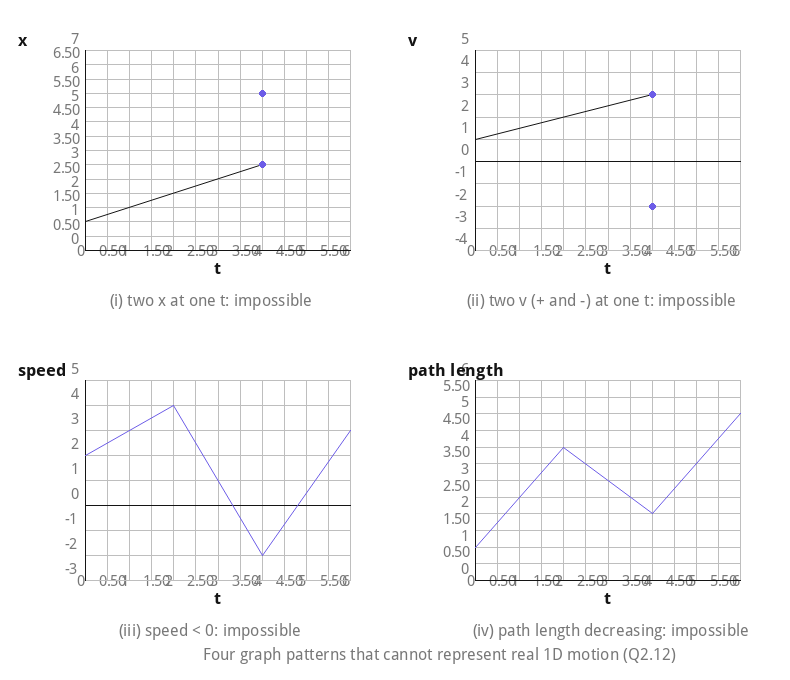
Q2. 12: Which Graphs Cannot Represent One-Dimensional Motion? — Four graphs are given; state which ones cannot possibly represent the one-dimensional…
Four graphs are given; state which ones cannot possibly represent the one-dimensional motion of a particle, with reasons. (i) An x-t graph showing two different values of position x at the same instant of time is not possible, because a particle can only be at one location at any given instant. (ii) A v-t graph showing two different velocities (one positive, one negative) at the same instant of time is not possible, since a particle cannot have two different velocities simultaneously. (iii) A speed-time graph that dips below the time axis (negative speed) is not physically possible, because speed is the magnitude of velocity and is always zero or positive. (iv) A path-length-time graph in which the total path length decreases with time is not possible, because total distance travelled (like an odometer reading) can only stay the same or increase, never decrease. None of the four graphs (i)-(iv) can represent real one-dimensional motion, for the reasons given above.
Q2. 13: Interpreting an x-t Graph – Straight Line or Parabola? — The x-t plot of a particle shows a horizontal (constant-x) line for t < 0 and a curved,…
The x-t plot of a particle shows a horizontal (constant-x) line for t < 0 and a curved, parabola-like line for t > 0. Is it correct to say the particle “moves in a straight line for t < 0 and on a parabolic path for t > 0”? This is not correct, because an x-t graph plots position along the single axis of motion against time – it is not a picture of the particle’s spatial path or trajectory. In genuine one-dimensional motion, the particle always moves along the same straight line at every instant, regardless of the shape of its x-t graph. A suitable physical situation is a ball resting at a fixed position (constant x, zero velocity) for t < 0, which is then released and falls freely under gravity from t = 0 onward – its x-t graph is flat before release and a rising parabola (since x ∝ t² under constant acceleration) afterward. The statement is incorrect; the x-t graph does not depict the physical path – a ball dropped from rest at t = 0 is a suitable physical context.
Q2. 14: Relative Speed of a Bullet Fired from a Moving Police Van — A police van moving at 30 km h-1 fires a bullet at a thief's car speeding away in the…
A police van moving at 30 km h-1 fires a bullet at a thief’s car speeding away in the same direction at 192 km h-1. If the bullet’s muzzle speed (relative to the van) is 150 m s-1, at what speed does the bullet hit the thief’s car? Speed of the police van = 30 × 5/18 = 25/3 m s-1. Speed of the thief’s car = 192 × 5/18 = 160/3 m s-1. Since the muzzle speed is relative to the moving van, the bullet’s speed relative to the ground = 25/3 + 150 = 475/3 m s-1. The speed at which the bullet actually strikes the thief’s car (the speed relevant for damage) is the bullet’s speed relative to the car = 475/3 − 160/3 = 315/3 = 105 m s-1. The bullet hits the thief’s car at a relative speed of 105 m s-1.
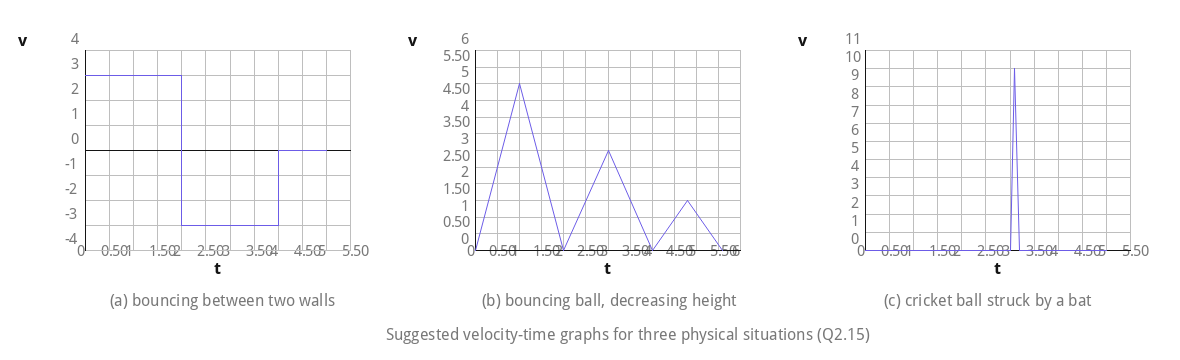
Q2. 15: Suggesting Physical Situations for Given v-t Graphs — Suggest a suitable physical situation for each of three given velocity-time graphs. (a)…
Suggest a suitable physical situation for each of three given velocity-time graphs. (a) The graph shows velocity constant and positive for a while, then abruptly switching to a constant negative value, and finally dropping to zero – this matches a ball bouncing back and forth between two walls of a smooth alley, rebounding at each wall until it comes to rest. (b) The graph shows a series of decreasing peaks, each smaller than the last – this matches a ball dropped onto a hard floor, bouncing repeatedly with each rebound reaching a smaller height (and hence smaller speed) than the last, due to energy lost at each bounce. (c) The graph shows velocity at zero for a while, then shooting up to a large value for only a very brief instant before returning to zero – this matches a cricket ball, moving uniformly, being struck sharply by a bat and given a large velocity change over an extremely short contact time. (a) a ball bouncing between two walls, (b) a ball dropped on the floor bouncing with decreasing height each time, (c) a cricket ball struck by a bat for a very short time interval.
Q2. 16: Signs of Position, Velocity and Acceleration in SHM — The x-t plot of a particle executing one-dimensional simple harmonic motion is given.…
The x-t plot of a particle executing one-dimensional simple harmonic motion is given. State the signs of its position, velocity and acceleration at t = 0.3 s, t = 1.2 s and t = -1.2 s. In SHM, acceleration is always directed opposite to displacement (a = -ω²x), so whenever x is positive, a is negative, and vice versa. Reading the slope and position from the curve at each instant: at t = 0.3 s, the particle is on the negative side of the mean position and still moving further negative, so x < 0, v < 0, hence a > 0. At t = 1.2 s, the particle is on the positive side and still moving further positive, so x > 0, v > 0, hence a < 0. At t = -1.2 s, the particle is on the negative side but moving back towards the mean position (x becoming less negative with time), so x < 0, v > 0, hence a > 0. t = 0.3 s: x < 0, v < 0, a > 0. t = 1.2 s: x > 0, v > 0, a < 0. t = -1.2 s: x < 0, v > 0, a > 0.
Q2. 17: Average Speed and Velocity from an x-t Graph (Three Intervals) — The x-t plot of a particle's motion shows three equal, successive time intervals (1, 2…
The x-t plot of a particle’s motion shows three equal, successive time intervals (1, 2 and 3). In which interval is the average speed greatest, and in which is it least? Give the sign of average velocity in each interval. Average speed over an interval equals the magnitude of the slope of the chord joining the graph’s end-points for that interval, so the interval with the steepest chord has the greatest average speed, and the flattest chord has the least. Reading the graph, the chord for interval 3 is steepest, so average speed is greatest in interval 3, while the chord for interval 2 is flattest, so average speed is least in interval 2. Since x increases with time in intervals 1 and 2, average velocity is positive in intervals 1 and 2; since x decreases with time in interval 3, average velocity is negative in interval 3.
Q2. 18: Average Acceleration and Speed from a Speed-Time Graph — A speed-time graph of a particle moving along a constant direction shows three equal…
A speed-time graph of a particle moving along a constant direction shows three equal time intervals, with the speed rising in interval 1, falling more steeply in interval 2, and staying roughly level near its peak in interval 3, flattening out at four points A, B, C and D. In which interval is the average acceleration greatest in magnitude, and in which is the average speed greatest? What are the accelerations at A, B, C and D? Average acceleration equals the change in speed divided by the (equal) time interval, so it is greatest in magnitude wherever the graph falls most steeply – this occurs in interval 2. The average speed (the general height of the curve) is greatest in interval 3, where the particle is moving fastest overall. Since the particle keeps moving in the same direction throughout, velocity v > 0 in all three intervals; acceleration a is positive in interval 1 (speed rising), negative in interval 2 (speed falling), and effectively zero in interval 3 (speed roughly constant). At each of A, B, C and D, the curve is momentarily flat (a local peak or plateau), so the slope – and hence the acceleration – is zero at all four points A, B, C and D.
Class 11 Physics Chapter 2 – Notes and Extra Questions
Along with these NCERT Solutions, students can also use the Class 11 Physics Chapter 2 Extra Questions and Class 11 Physics Chapter 2 Revision Notes for quick revision and extra practice.
- Chapter 1: Units and Measurements (2026-27)
- Chapter 3: Motion in a Plane – Free PDF Download
- Chapter 4: Laws of Motion – Free PDF Download
- Chapter 5: Work, Energy and Power – Free PDF Download
- Chapter 6: System of Particles and Rotational Motion – Free PDF Download
- Chapter 7: Gravitation – Free PDF Download
- Chapter 8: Mechanical Properties of Solids – Free PDF Download
- Chapter 9: Mechanical Properties of Fluids – Free PDF Download
- Chapter 10: Thermal Properties of Matter – Free PDF Download
- Chapter 11: Thermodynamics – Free PDF Download
- Chapter 12: Kinetic Theory – Free PDF Download
- Chapter 13: Oscillations – Free PDF Download
- Chapter 14: Waves – Free PDF Download
Frequently Asked Questions
What is the difference between distance and displacement?
Distance is the total path length covered by an object, irrespective of direction – it is a scalar quantity that can only increase or stay the same with time. Displacement is the vector connecting the object’s initial and final positions in a straight line, so it depends only on the start and end points, can be positive, negative or zero, and its magnitude can never be greater than the distance travelled.
What are the three equations of motion, and when can they be used?
The three equations are v = u + at, s = ut + ½at², and v² = u² + 2as, where u is initial velocity, v is final velocity, a is acceleration, s is displacement and t is time. They apply only to motion along a straight line with uniform (constant) acceleration; they cannot be used directly if acceleration is changing with time.
What is the difference between uniform and non-uniform acceleration?
In uniform acceleration, velocity changes by equal amounts in every equal interval of time, so acceleration stays constant and the velocity-time graph is a straight line. In non-uniform acceleration, the rate of change of velocity itself keeps varying, so the velocity-time graph is a curve, and the standard equations of motion do not apply directly – calculus-based or graphical methods must be used instead.
How do you read position-time and velocity-time graphs?
On a position-time (x-t) graph, the slope at any point gives the instantaneous velocity – a steeper slope means higher speed, a flat line means the object is at rest, and a negative slope means motion in the negative direction. On a velocity-time (v-t) graph, the slope gives the instantaneous acceleration, while the area enclosed between the curve and the time axis over an interval gives the displacement during that interval.
Recommended: Buy the Printed NCERT Class 11 Physics Book Set
Contains Amazon affiliate links.
If you’d like a printed copy alongside the PDF, here’s a verified option:
Rs. 280
Price and availability may change on Amazon. As an Amazon Associate, ncertbooks.org earns from qualifying purchases.



Pingback: Class 11 Physics Chapter 14 Waves Revision Notes (2026-27)
Pingback: Class 11 Physics Chapter 6 System of Particles and Rotational Motion Extra Questions (2026-27)
Pingback: Class 11 Physics Chapter 6 System of Particles and Rotational Motion Revision Notes (2026-27)