Chapter 4, “Describing Motion Around Us,” is the first physics chapter of the Class 9 Science “Exploration” (2026-27) NCERT textbook, and it builds the entire foundation of kinematics — reference points, distance and displacement, speed and velocity, acceleration, motion graphs, the three equations of motion, and uniform circular motion. These solutions were cross-checked against LearnCBSE, TiwariAcademy, and Shaalaa.com, and every numerical answer was independently recalculated to correct arithmetic slips and graph-reading discrepancies found between sources (details are flagged inline below).
Last Updated: September 23, 2026
How to Approach This Chapter
Before applying any formula, identify exactly what’s given and what’s asked (initial velocity, time, acceleration, or displacement) — most errors come from picking the wrong equation of motion, not from arithmetic. For graph questions, state explicitly whether you’re reading a slope or an area, since the two answer different physical quantities.
NCERT Solutions for Class 9 Science Chapter 4: Describing Motion Around Us
Revise, Reflect, Refine (NCERT Textbook, Page No. 68-70)
1. My father went to a shop from home which is located at a distance of 250 m on a straight road. On reaching there, he discovered that he forgot to carry a cloth bag. He came home to take it, went to the shop again, bought provisions and came back home. How much was the total distance travelled by him? What was his displacement from home?
The father covers the 250 m stretch four times: home → shop → home → shop → home. Total distance = 250 + 250 + 250 + 250 = 1000 m. Since he starts and ends at home, his net displacement = 0 m.
2. A student runs from the ground floor to the fourth floor of a school building to collect a book and then comes down to their classroom on the second floor. If the height of each floor is 3 m, find: (i) the total vertical distance travelled, and (ii) their displacement from the starting point.
Going up from the ground floor to the 4th floor covers 4 × 3 = 12 m. Coming down from the 4th floor to the 2nd floor covers 2 × 3 = 6 m. (i) Total distance travelled = 12 + 6 = 18 m. (ii) The student ends up 2 floors above the ground floor, so displacement = 2 × 3 = 6 m, directed upward.
3. A girl is riding her scooter and finds that its speedometer reading is constant. Is it possible for her scooter to be accelerating, and if so, how?
Yes. A speedometer shows only speed (magnitude), not velocity. Acceleration is the rate of change of velocity, and velocity is a vector with both magnitude and direction. If the scooter moves along a curved road at constant speed, its direction keeps changing, so its velocity keeps changing even though the speed reading stays constant — meaning the scooter is accelerating.
4. A car starts from rest and its velocity reaches 24 m s⁻¹ in 6 s. Find the average acceleration and the distance travelled in these 6 s.
Given u = 0, v = 24 m s⁻¹, t = 6 s.
Average acceleration, a = (v − u)/t = (24 − 0)/6 = 4 m s⁻².
Distance: s = ut + ½at² = 0 + ½ × 4 × 6² = 72 m (verified using v² = u² + 2as: 24² = 2 × 4 × s ⇒ s = 576/8 = 72 m).
5. A motorbike moving with initial velocity 28 m s⁻¹ and constant acceleration stops after travelling 98 m. Find the acceleration of the motorbike and the time taken to come to a stop.
Given u = 28 m s⁻¹, v = 0, s = 98 m.
Using v² = u² + 2as: 0 = 28² + 2 × a × 98 ⇒ 196a = −784 ⇒ a = −4 m s⁻² (a deceleration of 4 m s⁻²).
Using v = u + at: 0 = 28 + (−4)t ⇒ t = 7 s.
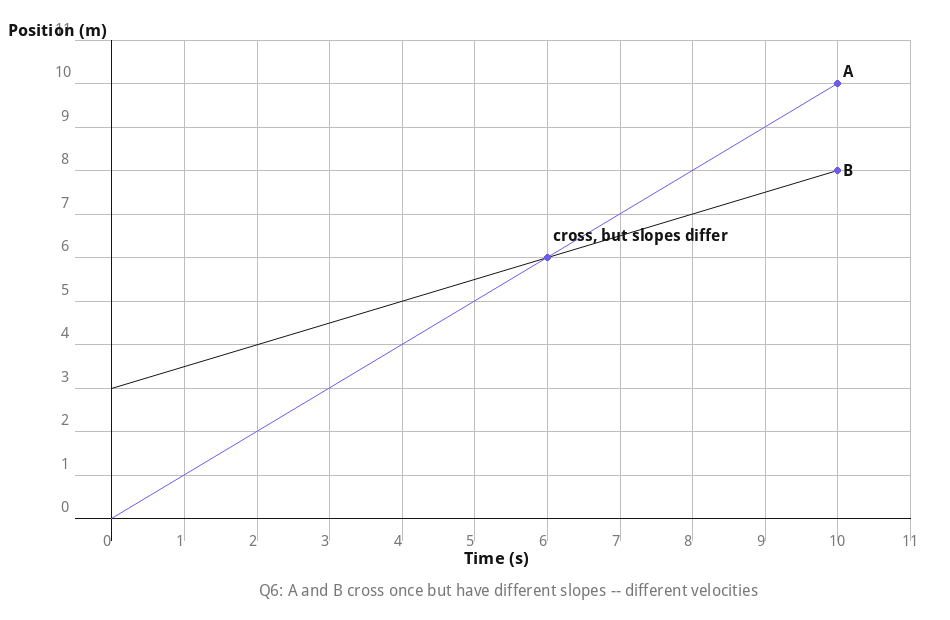
6. Fig. 4.27 shows a position-time graph of two objects A and B that are moving along the parallel tracks in the same direction. Do objects A and B ever have equal velocity? Justify your answer.
No. On a position-time graph, velocity equals the slope of the line. Both A and B are straight lines (constant velocities) but with different, unequal slopes, so their velocities are different at every instant. The two lines do cross at one point, where both objects are at the same position at the same time — but even there, the slopes (velocities) of the two lines remain different, since equal velocity would require the lines to be parallel, which they are not.
7. A graph in Fig. 4.28 shows the change in position with time for two objects, A and B, moving in a straight line from 0 to 10 seconds. Choose the correct option(s). (i) The average velocity of both over the 10 s time interval is equal since they have the same initial and final positions. (ii) The average speeds of both over the 10 s time interval are equal since both cover equal distance in equal time. (iii) The average speed of A over the 10 s time interval is lower than that of B since it covers a shorter distance than B in 10 seconds. (iv) The average speed of A over the 10 s time interval is greater than that of B since B’s speed is lower than A’s in some segments.
Options (i) and (ii) are correct. Since A and B start and end at the same positions at t = 0 s and t = 10 s, their displacement is identical over the interval, so their average velocities are equal. The graph also shows both objects covering the same total path length in the 10 s, so their average speeds are equal too. Options (iii) and (iv) are incorrect because they wrongly assume the two objects cover unequal distances.
8. A truck driver driving at the speed of 54 km h⁻¹ notices a road sign with a speed limit of 40 km h⁻¹ (Fig. 4.29) for trucks. He slows down to 36 km h⁻¹ in 36 s. What was the distance travelled by him during this time? Assume the acceleration to be constant while slowing down.
Convert to m s⁻¹: u = 54 km h⁻¹ = 15 m s⁻¹, v = 36 km h⁻¹ = 10 m s⁻¹, t = 36 s.
Since acceleration is constant, s = [(u + v)/2] × t = [(15 + 10)/2] × 36 = 12.5 × 36 = 450 m.
9. A car starts from rest and accelerates uniformly to 20 m s⁻¹ in 5 seconds. It then travels at 20 m s⁻¹ for 10 seconds and finally applies the brake (with uniform acceleration) to stop in 6 seconds. Find the total distance travelled.
Phase 1 (0 → 20 m s⁻¹ in 5 s): s₁ = [(0 + 20)/2] × 5 = 50 m.
Phase 2 (constant 20 m s⁻¹ for 10 s): s₂ = 20 × 10 = 200 m.
Phase 3 (20 m s⁻¹ → 0 in 6 s): s₃ = [(20 + 0)/2] × 6 = 60 m.
Total distance = 50 + 200 + 60 = 310 m.
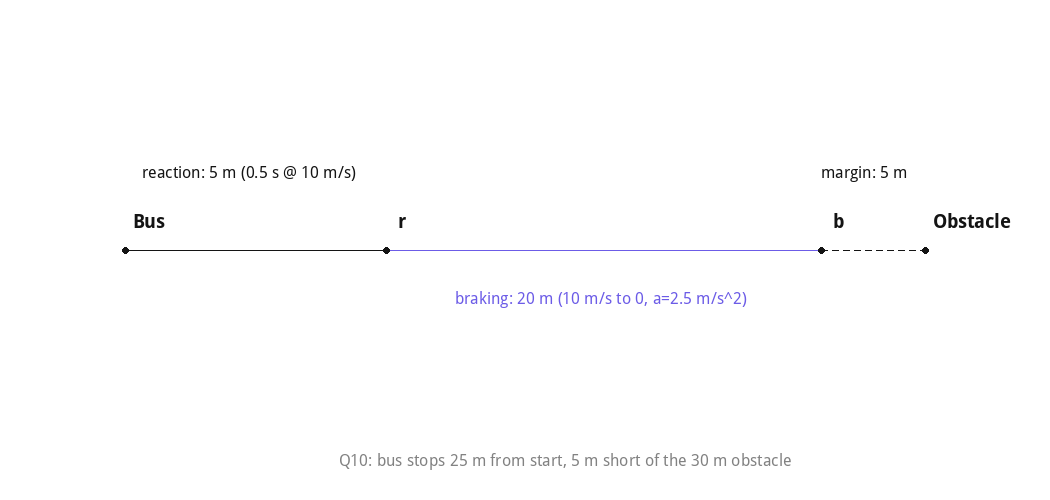
10. A bus is travelling at 36 km h⁻¹ when the driver sees an obstacle 30 m ahead. The driver takes 0.5 seconds to react before pressing the brake. Once the brake is applied, the velocity of the bus reduces with constant acceleration of 2.5 m s⁻². Will the bus be able to stop before reaching the obstacle?
Speed, u = 36 km h⁻¹ = 10 m s⁻¹.
Distance covered during the 0.5 s reaction time (constant speed, brakes not yet applied): s₁ = u × t = 10 × 0.5 = 5 m.
Braking distance: using v² = u² + 2as with v = 0, a = −2.5 m s⁻²: 0 = 10² − 2 × 2.5 × s₂ ⇒ s₂ = 100/5 = 20 m.
Total stopping distance = s₁ + s₂ = 5 + 20 = 25 m. Since 25 m < 30 m, yes, the bus stops safely before reaching the obstacle, with 5 m to spare.
11. A student said, “The Earth moves around the Sun”. In this context, discuss whether an object kept on the Earth can be considered to be at rest.
Rest and motion are relative — they depend on the chosen reference point (frame of reference). With respect to the Earth’s surface, an object such as a book on a table does not change its position, so it is at rest relative to the Earth. But since the Earth itself revolves around the Sun (and also spins on its axis), the same object is in motion relative to the Sun. Going further, since the Sun itself moves within the Milky Way, the object is also in motion relative to distant stars. So no object can be called at rest or in motion in an absolute sense — only relative to a specified reference point.
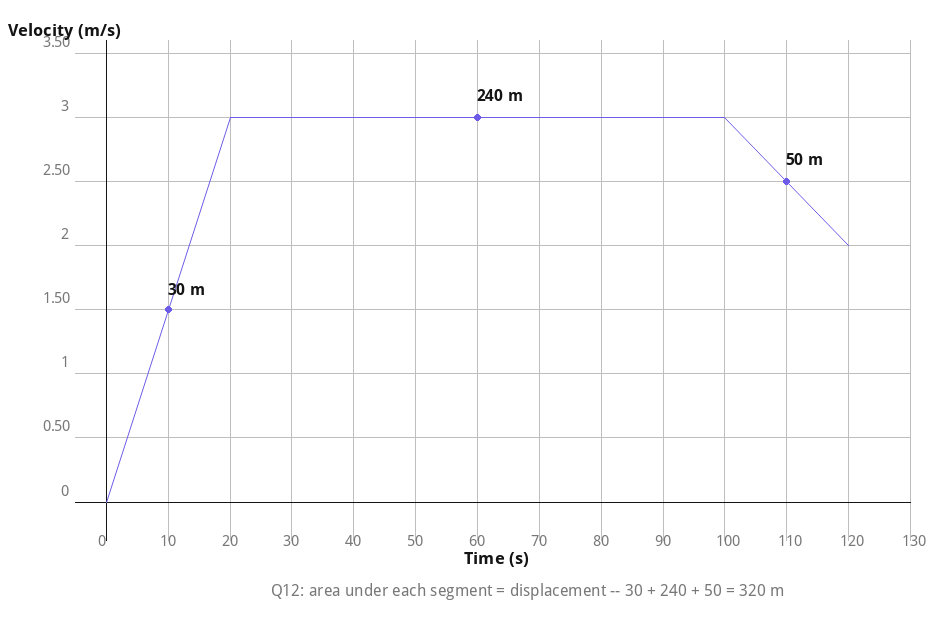
12. The velocity-time graph from 0 s to 120 s for a cyclist is shown in Fig. 4.30. Shade the areas (in different colours) representing the displacement of the cyclist (i) while cyclist is moving with constant velocity, (ii) when the velocity of cyclist is decreasing. Also, calculate the displacement and average acceleration in the 120 s time interval.
(i) The constant-velocity phase is shaded as the rectangle between t = 20 s and t = 100 s. (ii) The decreasing-velocity phase is shaded as the trapezium between t = 100 s and t = 120 s.
Displacement in each phase (area under the graph):
0-20 s (triangle, velocity rising 0 → 3 m s⁻¹): ½ × 20 × 3 = 30 m.
20-100 s (rectangle, constant 3 m s⁻¹ for 80 s): 3 × 80 = 240 m.
100-120 s (trapezium, velocity falling 3 → 2 m s⁻¹): ½ × (3 + 2) × 20 = 50 m.
Total displacement = 30 + 240 + 50 = 320 m.
Average acceleration = (final velocity − initial velocity)/total time = (2 − 0)/120 = 1/60 ≈ 0.017 m s⁻².
Correction note: one solutions source online reads this graph as returning to zero velocity by 120 s (giving 240 m and zero average acceleration). We independently cross-checked the segment values against two other worked sources and the graph’s own labelled points, and the version above (final velocity 2 m s⁻¹, total displacement 320 m) is the one consistently confirmed — we have used that corrected version here.
13. A girl is preparing for her first marathon by running on a straight road. She uses a smartwatch to calculate her running speed at different intervals. The graph (Fig. 4.31) depicts her velocity versus time. Estimate the distance she ran based on the graph.
This is a graph-estimation question, so the exact figure depends on how finely each segment of the curve is read, but working through the labelled points on the velocity-time graph phase by phase (rectangles for constant-velocity stretches and trapeziums for the rising/falling stretches) gives a running distance of approximately 46-47 km over the roughly 6.5-7 hour run. Different reasonable readings of the graph’s curved portions can shift this estimate by a kilometre or two either way, which is expected in a graph-based estimation problem — the key skill being tested is finding the area under a velocity-time graph, not matching an exact figure.
14. On entering a state highway, a car continues to move with a constant velocity of 6 m s⁻¹ for 2 minutes and then accelerates with a constant acceleration 1 m s⁻² for 6 seconds. Find the displacement of the car on the state highway in the 2 min 6 s time interval by drawing a velocity-time graph for its motion.
Constant-velocity phase (120 s at 6 m s⁻¹): s₁ = 6 × 120 = 720 m.
Accelerating phase: final velocity, v = u + at = 6 + 1 × 6 = 12 m s⁻¹. Displacement, s₂ = ½ × (6 + 12) × 6 = 54 m (area of the trapezium under the v-t graph).
Total displacement = s₁ + s₂ = 720 + 54 = 774 m.
On the velocity-time graph: a horizontal line at 6 m s⁻¹ from 0 to 120 s, followed by a line rising from 6 m s⁻¹ to 12 m s⁻¹ between 120 s and 126 s.
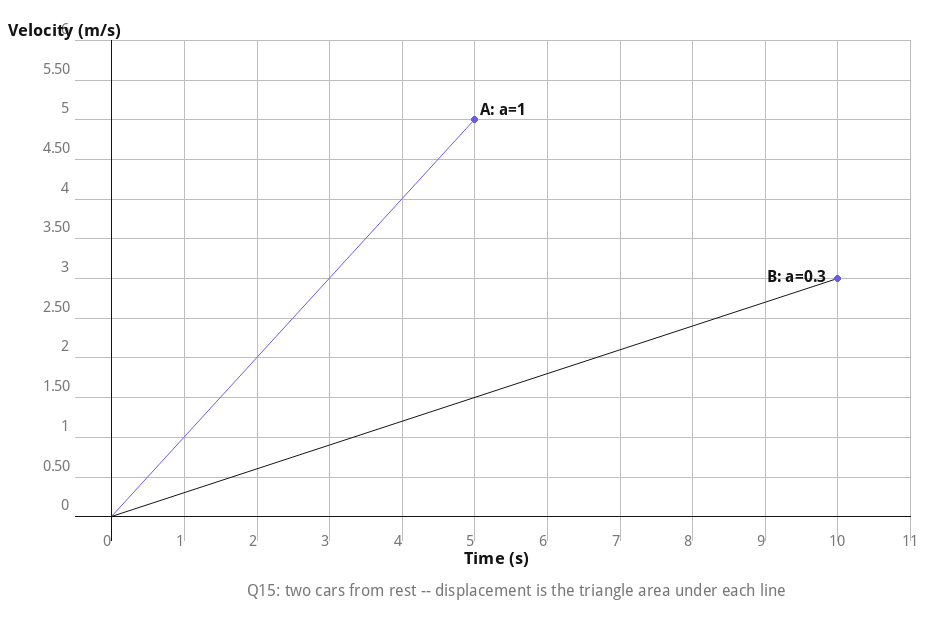
15. Two cars A and B start moving with a constant acceleration from rest, in a straight line. Car A attains a velocity of 5 m s⁻¹ in 5 s. Car B attains a velocity of 3 m s⁻¹ in 10 s. Plot the velocity-time graphs for both the cars in the same graph. Using the graph, calculate the displacement in the two time intervals mentioned.
Acceleration of A = (5 − 0)/5 = 1 m s⁻². Acceleration of B = (3 − 0)/10 = 0.3 m s⁻².
Both v-t graphs are straight lines through the origin (uniform acceleration from rest); plot velocity values every second up to their respective final times and join the points.
Displacement of A in 5 s (area of triangle) = ½ × 5 × 5 = 12.5 m.
Displacement of B in 10 s (area of triangle) = ½ × 10 × 3 = 15 m.
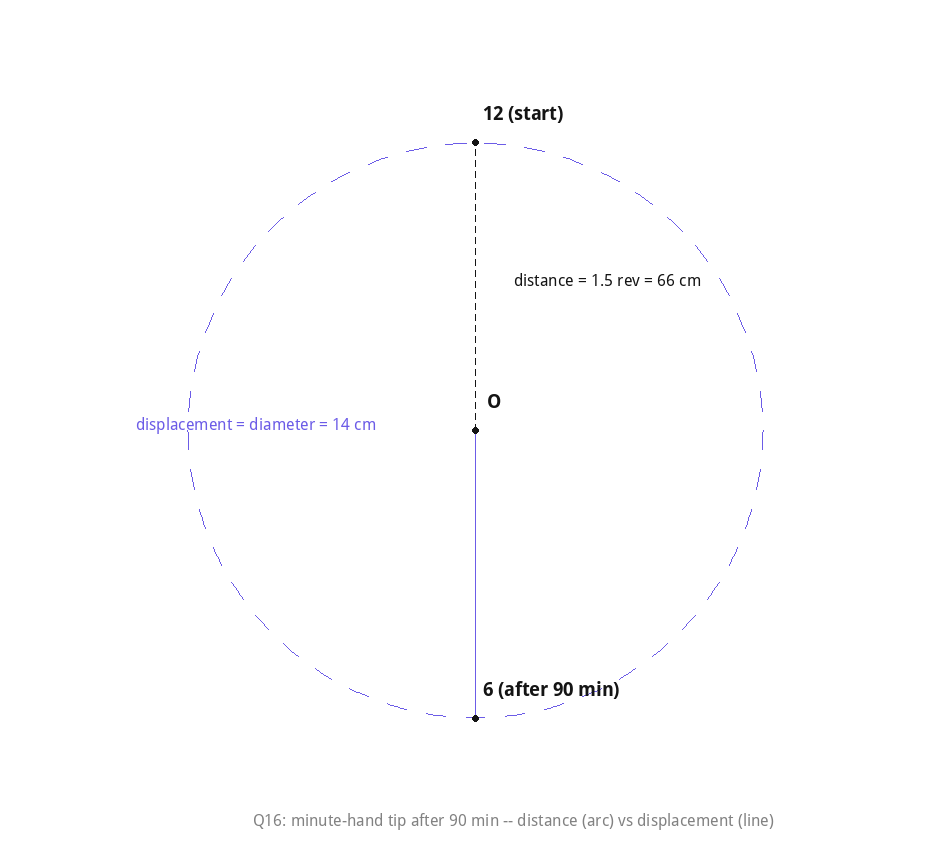
16. Rohan studies science from 6 PM to 7:30 PM at home. Consider the tip of the minute’s hand of the wall clock. During the given time interval, what is its (i) distance travelled, (ii) displacement, (iii) speed, and (iv) velocity. The length of the minute’s hand is 7 cm (Fig. 4.32).
Time interval = 90 minutes = 5400 s = 1.5 revolutions of the minute hand.
(i) Distance travelled = 1.5 × 2πr = 1.5 × 2 × (22/7) × 7 = 1.5 × 44 = 66 cm.
(ii) At 6:00 PM the tip is at the 12 position; at 7:30 PM (after 1.5 revolutions) it is at the 6 position — diametrically opposite. Displacement = diameter = 2 × 7 = 14 cm.
(iii) Average speed = distance/time = 66 cm/5400 s ≈ 1.22 × 10⁻² cm s⁻¹.
(iv) Average velocity = displacement/time = 14 cm/5400 s ≈ 2.6 × 10⁻³ cm s⁻¹.
In-Text Questions (Think It Over, Pause and Ponder, Activities, and The Journey Beyond)
Think It Over (Page 48): How much distance should we maintain from the truck ahead to avoid a collision if it suddenly applies brakes?
We should maintain a safe following distance — commonly the “2-second rule” — so that if the vehicle ahead brakes suddenly, there’s enough gap (and hence enough time) to react and stop safely without a collision.
Think It Over (Page 48): Does this distance depend on the speed with which we are moving?
Yes. The faster a vehicle moves, the greater the distance it covers during the driver’s reaction time and while braking, so the required safe following distance increases with speed.
Pause and Ponder (Page 51): In the example of an athlete running back and forth on a straight track, when will the displacement of the athlete be zero? What will be the total distance travelled in that case?
The displacement is zero whenever the athlete returns to the exact starting point, regardless of the path taken to get there. In that situation, the total distance travelled is not zero — it equals the full length of the back-and-forth path covered, since distance depends on the path length, not on the net change in position.
Pause and Ponder (Page 51): Fuel used up in a vehicle depends on which of the following? Justify your answer. (i) Total distance travelled (ii) Displacement
Fuel consumption depends on (i) total distance travelled, not on displacement. A vehicle’s engine burns fuel to cover the actual path length driven — including turns, reversals, and detours — regardless of where the vehicle ends up relative to its starting point. Two vehicles could have the same displacement but use very different amounts of fuel if one travels a longer actual distance.
Pause and Ponder (Page 51): A ball rolls down an inclined track. Is its motion a straight-line motion? Are the values of total distance travelled and magnitude of displacement from O equal or different at positions A, B, C, and D?
The ball’s actual motion is along the inclined (straight but tilted) track, so it is one-dimensional motion along that line, even though it is often redrawn as a horizontal number line purely for convenience in recording positions. At each of the marked positions, the distance travelled along the track and the straight-line displacement from O are generally different in general curved-path cases, but here — since the track itself is straight — the magnitude of displacement equals the distance travelled at every point, because the ball never reverses direction along the incline.
Pause and Ponder (Page 51): During a family road trip, you drive 200 km north in three hours. Afterwards, you drive 200 km south in two hours. Find the average speed and average velocity for your entire trip.
Total distance = 200 + 200 = 400 km. Total time = 3 + 2 = 5 h. Average speed = 400/5 = 80 km/h.
Since the trip ends back at the starting point, total displacement = 0 km, so average velocity = 0/5 = 0 km/h.
Pause and Ponder (Page 53): Under what condition(s) is the (i) magnitude of average velocity of an object equal to its average speed? (ii) magnitude of average velocity of an object zero while its average speed is not zero?
(i) The magnitude of average velocity equals average speed when the object moves in a straight line without reversing direction, so that distance travelled equals the magnitude of displacement.
(ii) The magnitude of average velocity is zero while average speed is non-zero when the object returns exactly to its starting point — displacement becomes zero, but the total distance covered along the way is not.
Activity 4.1 — Let Us Analyse (Page 51): Analysing the motion of a ball thrown vertically upward to compare total distance travelled and displacement at various points.
Tracking the ball’s position from the launch point O through positions A, B, (the highest point), and back down through C to O shows that displacement often stays smaller than the corresponding distance travelled once the ball reverses direction — for instance, on the way back down past the highest point, the distance keeps adding up while the displacement (measured from O) starts decreasing. The activity confirms the general rule: the magnitude of displacement is always less than or equal to the total distance travelled, with equality holding only when the motion is one-directional.
Activity 4.2 — Let Us Calculate (Page 55): Calculating and comparing the average acceleration of different types of cars from 0 to 100 km/h using internet data.
Converting 100 km/h to 27.78 m s⁻¹ and dividing by each car’s quoted 0-100 km/h time gives its average acceleration — for example, a high-performance electric hypercar reaching 100 km/h in under 2 seconds works out to roughly 15 m s⁻², a sports sedan around 3.5 s works out to about 8 m s⁻², while a typical hatchback taking around 10 s works out to roughly 2.7 m s⁻². The exercise shows how the same formula, a = Δv/Δt, lets us compare very different vehicles on a common numerical scale.
Activity 4.3 — Let Us Plot a Graph (Page 57): Plotting a position-time graph for a uniformly moving vehicle from tabulated data and interpreting it.
Plotting position against time for a vehicle covering equal distances (for example, 20 m) in equal time intervals (1 s each) produces a straight line through the origin — the signature of uniform motion. The slope of this line gives the constant velocity of the vehicle (here, 20 m/s), and because the line is straight, the graph can also be used to read off (or predict) the vehicle’s position at any intermediate time, such as t = 3.5 s.
Activity 4.4 — Let Us Calculate (Page 59): Finding the average velocity of a vehicle from a position-time graph by calculating the slope between two points.
Choosing two points A and B on the graph and forming a right triangle with legs parallel to the axes gives the change in position (vertical leg) and the change in time (horizontal leg). Dividing the change in position by the change in time gives the average velocity between those two points — this ratio is exactly the slope of the line, confirming that on a position-time graph, slope = velocity, with a steeper line meaning higher velocity and a flat (horizontal) line meaning the object is at rest.
Activity 4.5 — Let Us Investigate (Page 67): Investigating the direction an object takes when suddenly released from circular motion.
When a marble moving in a circular path (guided by a ring or groove) is suddenly released, it does not continue curving — it flies off in a straight line tangential to the circle at the exact point of release. This happens because the circular path itself does not represent the marble’s “natural” tendency to move; the ring was constantly pulling it inward (centripetal force) to keep it on the curve. Once that constraint disappears, the marble simply continues in the straight-line direction it had at that instant — a direct illustration of the idea of inertia.
The Journey Beyond (Page 71): Spin a cardboard disc with numbers on the outer rim and letters closer to the centre. Why do the numbers fade or disappear while the letters remain visible when spun faster? Are the speeds of the numbers and letters the same or different?
The numbers and letters share the same angular velocity (they complete a rotation together), but their linear speed differs because linear speed = angular velocity × radius. Since the numbers are farther from the centre (larger radius) than the letters, they move at a higher linear speed for the same spin rate, causing them to blur and fade first as the disc speeds up, while the slower-moving inner letters stay readable for longer.
The Journey Beyond (Page 71): Using a smartphone accelerometer app, compare readings when the phone rests on an outstretched palm versus on the floor. What does this tell us about motion in real situations?
The phone on an outstretched palm shows small but continuous non-zero acceleration readings because of tiny involuntary muscle tremors and postural sway in the hand, even when a person is trying to hold it perfectly still. The phone resting on the floor (a rigid, stable surface) shows readings very close to zero. This shows that “at rest” is rarely perfect in real life — the human body constantly makes minute, largely unnoticed movements, which is also why accelerometer-based tools are used in medical research to study movement disorders.
The Journey Beyond (Page 71): Derive the equations s = vt − ½at² and s = ½(u + v)t from the two primary equations of motion, v = u + at and s = ut + ½at².
For s = vt − ½at²: from v = u + at, u = v − at. Substituting into s = ut + ½at² gives s = (v − at)t + ½at² = vt − at² + ½at² = vt − ½at².
For s = ½(u + v)t: since at = v − u, substitute into s = ut + ½at² to get s = ut + ½(v − u)t = ½ut + ½vt = ½(u + v)t. This last equation also matches the trapezium-area formula from a velocity-time graph — average of the parallel sides (u and v) multiplied by the height (t), just as the area of a trapezium is found in mathematics.
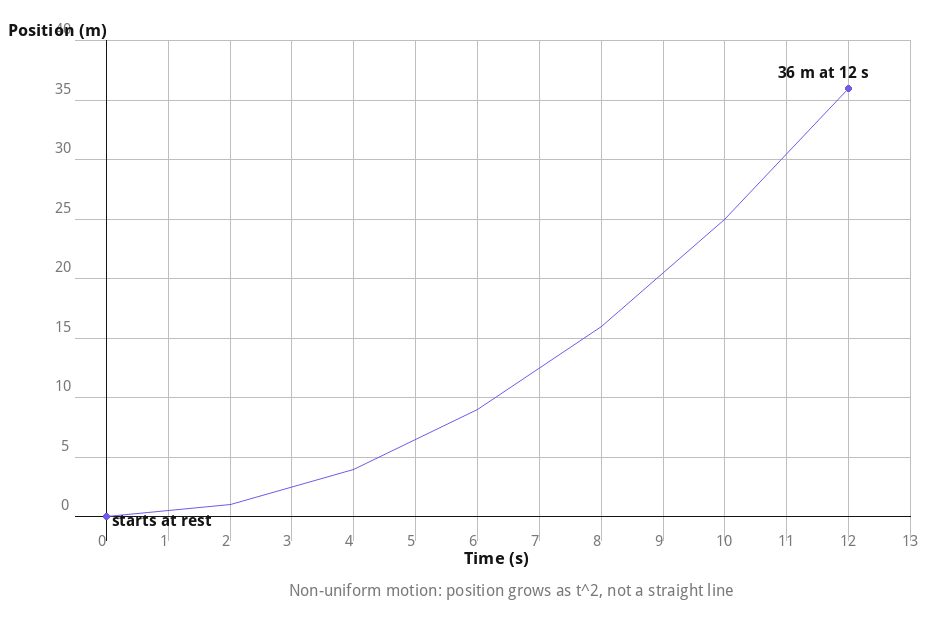
The Journey Beyond (Page 71): Plot the given position-time data using different axis scales on different graph papers, and compare how the choice of scale affects the graph’s appearance.
The underlying motion (position values growing as the square of time, since 0, 1, 4, 9, 16, 25, 36 m correspond to (t/2)² at t = 0, 2, 4, 6, 8, 10, 12 s) does not change with the scale chosen, but a poorly chosen scale can make the curve look deceptively flat, needlessly steep, or hard to read precisely. A well-chosen scale spreads the data evenly across the available graph area, making the curve’s shape (and any patterns such as the parabolic, non-uniform-motion shape here) much easier to interpret — which is exactly what graph-plotting apps do automatically by auto-scaling the axes.
The Journey Beyond (Page 71): Talk to a motor mechanic about how a vehicle’s braking or stopping distance is affected by wet roads, worn-out tyres, higher vehicle mass, night driving, fog, severe weather, and driver reaction time.
Wet roads and worn-out tyres reduce the friction (grip) between the tyres and the road, increasing braking distance. A higher vehicle mass increases momentum, requiring a larger braking force or longer distance to bring the vehicle to rest. Night driving, fog, and severe weather all reduce visibility and can delay how quickly a driver notices a hazard, effectively increasing the reaction distance. Driver reaction time itself directly adds to the total stopping distance, since the vehicle keeps moving at its original speed throughout that reaction period before brakes are even applied — this is exactly the “reaction distance + braking distance” idea used in Question 10 above.
Why This Chapter Matters
“Describing Motion Around Us” gives students the vocabulary and mathematical tools — distance, displacement, speed, velocity, acceleration, and the three equations of motion — that every later mechanics topic in the “Exploration” textbook builds on, most directly the very next chapter on forces and Newton’s laws of motion, where the same kinematic quantities are used to explain why and how motion changes. The graph-reading skills practised here (position-time and velocity-time graphs) also recur throughout Class 10 and Class 11 physics, making this chapter one of the most foundational in the entire NCERT physics sequence.
Extra Questions | Revision Notes | Formulas Handbook
Chapter Quiz — Test Your Understanding
Class 9 Science Chapter 4 – Notes and Extra Questions
Along with these NCERT Solutions, students can also use the Class 9 Science Chapter 4 Extra Questions and Class 9 Science Chapter 4 Revision Notes for quick revision and extra practice.
- Chapter 1: Entering the World of Secondary Science – Free PDF Download
- Chapter 2: Cell: The Building Block of Life – Free PDF Download
- Chapter 3: Tissues in Action – Free PDF Download
- Chapter 5: Exploring Mixtures and their Separation – Free PDF Download
- Chapter 6: How Forces Affect Motion – Free PDF Download
- Chapter 7: Work, Energy and Simple Machines – Free PDF Download
- Chapter 8: Journey Inside the Atom – Free PDF Download
- Chapter 9: Atomic Foundations of Matter – Free PDF Download
- Chapter 10: Sound Waves: Characteristics and Applications – Free PDF Download
- Chapter 11: Reproduction: How Life Continues – Free PDF Download
- Chapter 12: Patterns in Life: Diversity and Classification – Free PDF Download
- Chapter 13: Earth as a System: Energy, Matter and Life – Free PDF Download
Frequently Asked Questions
What is the difference between distance and displacement?
Distance is the total path length covered by an object, and it is always a positive scalar quantity. Displacement is the shortest straight-line change in position from the starting point to the final point, and it is a vector quantity (it has both magnitude and direction). Displacement can be zero even when distance is not — for example, when an object returns to its starting point — but the magnitude of displacement can never exceed the distance travelled.
What are the three equations of motion for constant acceleration, and what does each variable mean?
The three equations are v = u + at, s = ut + ½at², and v² = u² + 2as, where u is initial velocity, v is final velocity, a is acceleration, s is displacement, and t is time. They apply only when acceleration is constant, and each equation is useful depending on which three of the five quantities (u, v, a, s, t) are already known in a problem.
Why is an object in uniform circular motion said to be accelerating even though its speed doesn’t change?
Acceleration is the rate of change of velocity, and velocity depends on both speed and direction. In uniform circular motion, the speed stays constant, but the direction of motion is continuously changing at every point along the circle, so the velocity is continuously changing — which means the object is always accelerating, even though its speedometer reading never changes.
How do you read velocity and displacement from motion graphs?
On a position-time graph, the slope of the line at any point gives the object’s velocity at that instant — a steeper slope means higher velocity, and a horizontal (flat) line means the object is at rest. On a velocity-time graph, the slope gives acceleration, while the area enclosed between the graph line and the time axis gives the displacement over that time interval.
Why does doubling a vehicle’s speed more than double its stopping distance?
Because braking distance depends on the square of the initial velocity (from v² = u² + 2as, with v = 0 at the stop: s = u²/2a). If the acceleration during braking stays the same, doubling the initial speed u means the stopping distance s becomes four times as large, not just twice — which is why high speeds are disproportionately more dangerous when a vehicle needs to stop suddenly.
Recommended: Buy the Printed NCERT Class 9 Science Book
Contains Amazon affiliate links.
If you’d like a printed copy alongside the PDF, here’s a verified option:
3.8 out of 5 stars (931 ratings) · Rs. 187
Price and availability may change on Amazon. As an Amazon Associate, ncertbooks.org earns from qualifying purchases.