Two data sets can share the same mean and still look very different, which is why Chapter 13 of Class 11 Maths introduces measures of dispersion. Range, mean deviation, variance, and standard deviation each describe spread in their own way, with standard deviation the most commonly used.
Last Updated: September 23, 2026
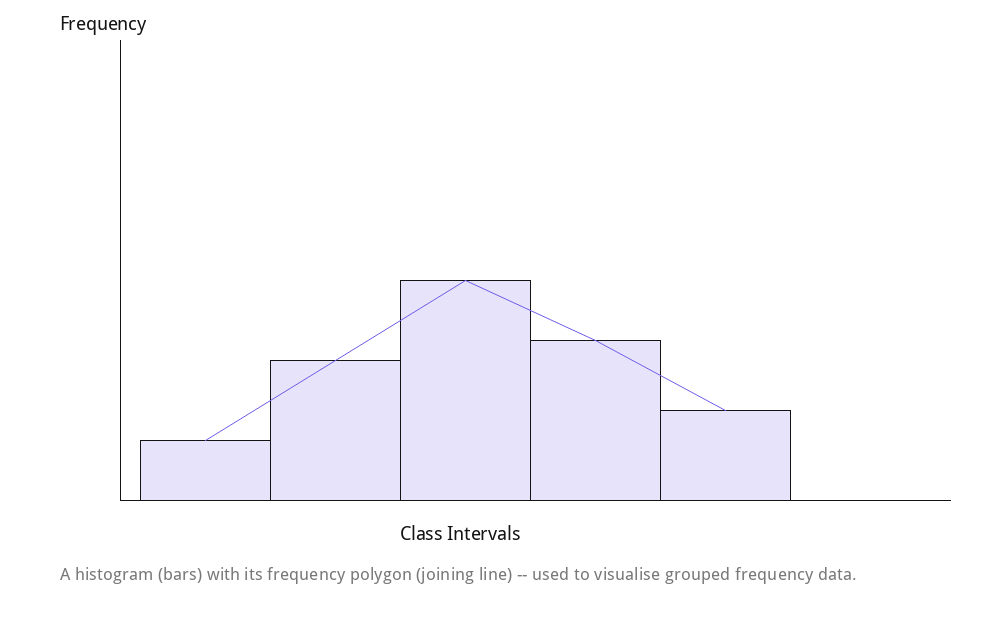 Reference figure: a histogram of grouped data, illustrating how frequency-distribution data used throughout this chapter is visualised.
Measures of Dispersion
- Range = max−min.
- Mean deviation = ∑|xi−mean|/n.
- Variance σ² = ∑(xi−mean)²/n.
- Standard deviation σ = √(variance).
Key Points
- Std dev always ≥ 0; 0 means all values identical.
- Smaller std dev = more consistent/less spread data.
- Std dev preferred over variance (same units as data).
One-Line Summary
Measures of dispersion (range, mean deviation, variance, standard deviation) describe how spread out data is around the mean, with standard deviation being the most widely used since it returns to the data’s original units.
- Chapter 1: Sets - Quick Revision Notes
- Chapter 2: Relations and Functions – Revision Notes
- Chapter 3: Trigonometric Functions – Revision Notes
- Chapter 4: Complex Numbers and Quadratic Equations – Revision Notes
- Chapter 5: Linear Inequalities – Revision Notes
- Chapter 6: Permutations and Combinations – Revision Notes
- Chapter 7: Binomial Theorem – Revision Notes
- Chapter 8: Sequences and Series – Revision Notes
- Chapter 9: Straight Lines – Revision Notes
- Chapter 10: Conic Sections – Revision Notes
- Chapter 11: Introduction to Three Dimensional Geometry – Revision Notes
- Chapter 12: Limits and Derivatives – Revision Notes
- Chapter 14: Probability – Revision Notes
Frequently Asked Questions
Why do we need measures of dispersion in addition to measures of central tendency like mean?
Two data sets can have the same mean but very different spreads. Measures of dispersion such as range, mean deviation, variance and standard deviation describe how much the data varies around the mean, giving a fuller picture.
What does a smaller standard deviation indicate about a data set?
A smaller standard deviation means the data points are clustered closer to the mean, indicating more consistency, while a larger standard deviation means the data is more spread out.
Chapter Quiz — Test Your Understanding
Class 11 Maths Chapter 13 – Solutions and Important Questions
Need full answers or more practice? See the Class 11 Maths Chapter 13 Solutions and Class 11 Maths Chapter 13 Extra Questions.
See also: Chapter 2 | Chapter 3 | Chapter 4 | Chapter 5 | Chapter 6 | Chapter 7 | Chapter 8 | Chapter 9 | Chapter 10 | Chapter 11 | Chapter 12 | Chapter 13
Practice more: Chapter 2 | Chapter 3 | Chapter 4 | Chapter 5 | Chapter 6 | Chapter 7 | Chapter 8 | Chapter 9 | Chapter 10 | Chapter 11 | Chapter 12 | Chapter 13
Quick revision: Chapter 2 | Chapter 3 | Chapter 4 | Chapter 5 | Chapter 6 | Chapter 7 | Chapter 8 | Chapter 9 | Chapter 10 | Chapter 11 | Chapter 12
Recommended: Buy the Printed NCERT Class 11 Maths Book
Contains Amazon affiliate links.
If you’d like a printed copy alongside the PDF, here’s a verified option:
4.2 out of 5 stars (953 ratings) · Rs. 170
Price and availability may change on Amazon. As an Amazon Associate, ncertbooks.org earns from qualifying purchases.