Genuinely harder, HOTS-level practice for Class 10 Maths Chapter 13 (Statistics), going beyond the textbook exercises with fresh numbers, general proofs, and reverse-engineering problems. These Class 10 Mathematics Chapter 13 important questions are handy for last-minute exam practice.
Last Updated: September 23, 2026
How to Approach the HOTS Questions in This Chapter
HOTS questions here often give you the mean or median and ask you to find a missing frequency, requiring the formula to be worked backward — practice this reverse approach rather than only computing mean/median/mode forward from complete data.
- Q1 (General proof). Show that the step-deviation mean formula is algebraically equivalent to the direct mean formula.
Solution: Since uᵢ=(xᵢ-a)/h, xᵢ=a+huᵢ. So Σfᵢxᵢ=aΣfᵢ+hΣfᵢuᵢ. Dividing by Σfᵢ: Σfᵢxᵢ/Σfᵢ = a+h(Σfᵢuᵢ/Σfᵢ) — the direct-method mean equals the step-deviation formula for any a and h. Hence proved — both methods always give the same numeric mean. - Q2 (Reverse-engineering). The mean of a distribution with classes 0-20(5), 20-40(f₁), 40-60(10), 60-80(f₂), 80-100(7), 100-120(8), total 50, is 62.8. Find f₁ and f₂.
Solution: 5+f₁+10+f₂+7+8=50 ⇒ f₁+f₂=20. Step-deviation a=50,h=20: Σfᵢuᵢ=28-f₁+f₂. 62.8=50+[(28-f₁+f₂)/50]×20 ⇒ f₂-f₁=4. Solving: f₁=8, f₂=12. - Q3 (Assertion-Reason). Assertion (A): Mode = l+[(f₁-f₀)/(2f₁-f₀-f₂)]×h. Reason (R): The modal class is the class with the highest cumulative frequency.
(a) Both true, R explains A (b) Both true, R doesn’t explain A (c) A true, R false (d) A false, R true
Solution: A is the correct mode formula (true). R is false — the modal class has the highest frequency, not highest cumulative frequency (cf is always largest for the last class). Answer: (c). - Q4 (Fresh numbers, mean). Marks of 60 students: 0-10(3),10-20(9),20-30(15),30-40(18),40-50(11),50-60(4). Find the mean by step-deviation.
Solution: a=35,h=10: Σfᵢuᵢ=-23. Mean=35+(-23/60)×10=31.17 marks (approx.). - Q5 (Fresh numbers, mode). Daily max temperature (°C) over 50 days: 20-24(6),24-28(10),28-32(16),32-36(12),36-40(6). Find the modal temperature.
Solution: Modal class 28-32 (f=16): l=28,f₁=16,f₀=10,f₂=12,h=4. Mode=28+[6/10]×4=30.4°C. - Q6 (Fresh numbers, median). Weekly wages (Rs hundred) of 45 workers: 0-10(5),10-20(8),20-30(20),30-40(7),40-50(5). Find the median wage.
Solution: cf:5,13,33,40,45. n=45,n/2=22.5; median class 20-30. l=20,cf=13,f=20,h=10. Median=20+[(22.5-13)/20]×10=24.75, i.e. Rs 2475. - Q7 (Verify empirical relationship). For classes 10-20(4),20-30(8),30-40(14),40-50(18),50-60(10),60-70(6), find mean, median, mode and verify 3×Median = Mode+2×Mean.
Solution: Mean (a=35,step-dev): Σfᵢuᵢ=40, Mean=35+6.67=41.67. Median (n=60,n/2=30,cf 4,12,26,44,54,60,class 40-50): Median=40+2.22=42.22. Mode (modal class 40-50,f=18): Mode=40+3.33=43.33. Check: 3×42.22=126.67; 43.33+2(41.67)=126.67. Verified.
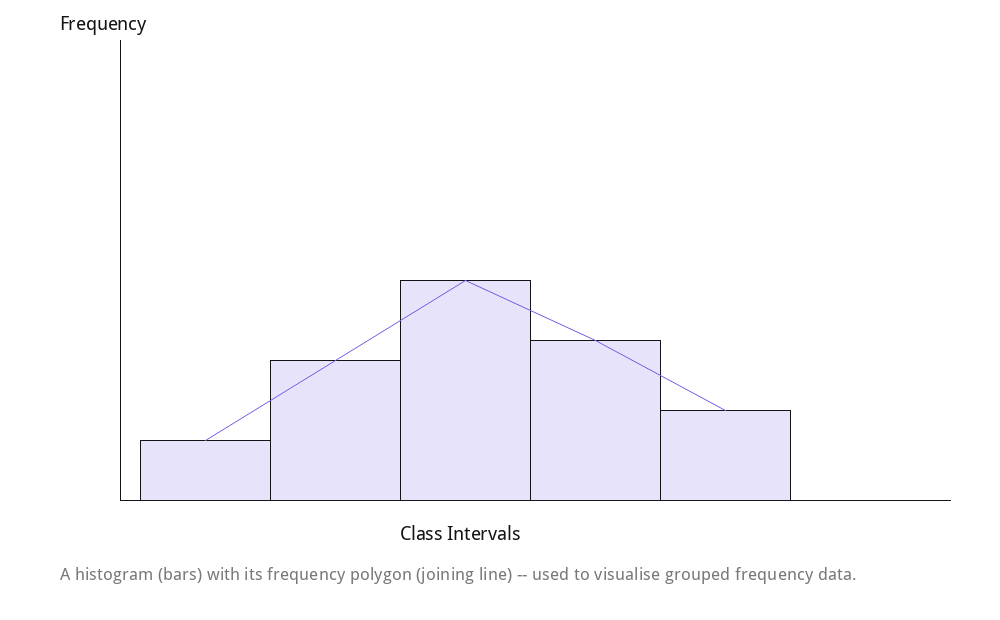 Reference figure: a histogram of grouped data, illustrating how frequency-distribution data used throughout this chapter is visualised.
- NCERT Solutions – Chapter 13
- Extra Questions (HOTS) – Chapter 13
- Revision Notes – Chapter 13
- Class 10 Maths Book (Catalog Page)
- Chapter 1: Real Numbers
- Chapter 2: Extra Questions - Polynomials (HOTS)
- Chapter 3: Pair of Linear Equations in Two Variables
- Chapter 4: Quadratic Equations
- Chapter 5: Arithmetic Progressions
- Chapter 6: Triangles
- Chapter 7: Coordinate Geometry
- Chapter 8: – Introduction to Trigonometry
- Chapter 9: Extra Questions - Some Applications of Trigonometry (HOTS)
- Chapter 10: Extra Questions - Circles (HOTS)
- Chapter 11: Areas Related to Circles Extra Questions (HOTS)
- Chapter 12: Surface Areas and Volumes Extra Questions (HOTS)
- Chapter 14: Probability Extra Questions (HOTS)
Frequently Asked Questions
What is the difference between the mean, median, and mode of a data set, and when might they give different values?
The mean is the average of all values, the median is the middle value when data is arranged in order, and the mode is the most frequent value; these can differ significantly when a data set contains extreme values.
Why might the median be a better measure of central tendency than the mean for certain data sets?
The median is not affected by extremely high or low outlier values, while the mean can be significantly skewed by such outliers, making the median more reliable for data sets with extreme values.
Chapter Quiz — Test Your Understanding
Class 10 Mathematics Chapter 13 – Solutions and Notes
For complete step-by-step answers and a quick summary, check the Class 10 Mathematics Chapter 13 Solutions and Class 10 Mathematics Chapter 13 Revision Notes.
Recommended: Buy the Printed NCERT Class 10 Maths Book
Contains Amazon affiliate links.
If you’d like a printed copy alongside the PDF, here’s a verified option:
4.4 out of 5 stars (836 ratings) · Rs. 125
Price and availability may change on Amazon. As an Amazon Associate, ncertbooks.org earns from qualifying purchases.