Probability estimated from real trials, like the fraction of heads in 100 coin tosses, is called empirical probability, and these questions test how it’s calculated and interpreted.
Last Updated: September 23, 2026
Very Short Answer Questions (1 mark)
Q1. A coin is tossed 100 times, and heads comes up 55 times. Find the empirical probability of getting heads.
Ans: P(heads) = 55/100 = 0.55.
Q2. What is the minimum possible value of probability?
Ans: 0.
Q3. What is the maximum possible value of probability?
Ans: 1.
Q4. Define an ‘event’ in probability.
Ans: A collection of one or more outcomes of an experiment.
Q5. If an event is impossible based on observed data, what is its empirical probability?
Ans: 0.
Short Answer Questions (2–3 marks)
Q6. In 500 attempts, a basketball player scores a basket 320 times. Find the empirical probability of scoring, and of missing.
Ans: P(scoring) = 320/500 = 0.64. P(missing) = (500−320)/500 = 180/500 = 0.36.
Q7. A die is rolled 60 times, and the number 6 appears 12 times. Find the empirical probability of rolling a 6, and compare it to what you might expect from a fair die.
Ans: P(rolling a 6) = 12/60 = 0.2 = 1/5. A fair die would theoretically give 1/6 ≈ 0.167; the observed value 0.2 is somewhat higher but reasonably close, given the limited number of trials (60).
Q8. Explain why empirical probability might give different values for the “same” experiment (like tossing a coin) if repeated on different days with different sample sizes.
Ans: Empirical probability depends directly on the specific set of trials conducted, and small sample sizes are more subject to random variation. With a small number of trials, results can deviate noticeably from the expected long-run pattern; larger sample sizes tend to give more consistent and stable empirical probabilities closer to the true underlying probability.
Higher-Order Thinking / Application Questions
Q9. A survey of 250 families found that 150 families have at least one child studying in a government school. Using this data, estimate the probability that a randomly selected family from this survey has a child in a government school, and explain what assumption this estimate relies on.
Ans: P(family has a child in government school) = 150/250 = 0.6. This estimate relies on the assumption that the surveyed 250 families are representative of the larger population being studied — if the sample was biased (e.g., only surveyed in one particular area), the estimate may not generalise well.
Q10. A factory tests 1000 bulbs and finds 15 defective. Using empirical probability, estimate how many defective bulbs might be expected in a batch of 5000 bulbs, showing your reasoning.
Ans: Empirical probability of a defective bulb = 15/1000 = 0.015. Expected number of defective bulbs in a batch of 5000 = 0.015 × 5000 = 75 bulbs. This reasoning assumes the defect rate remains consistent across production batches.
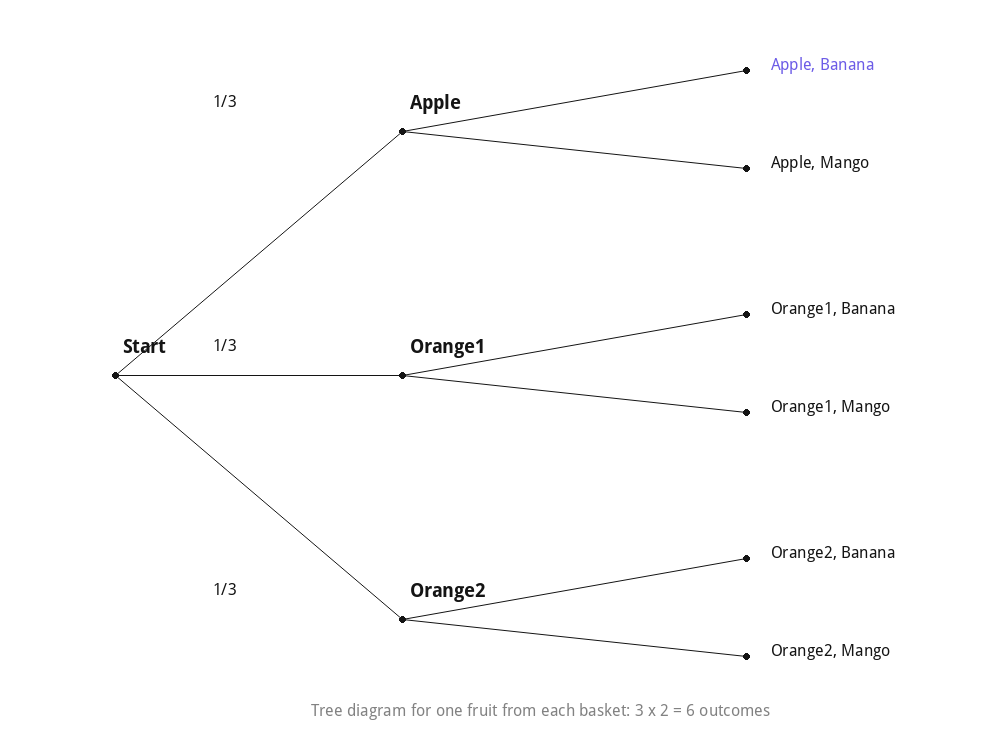
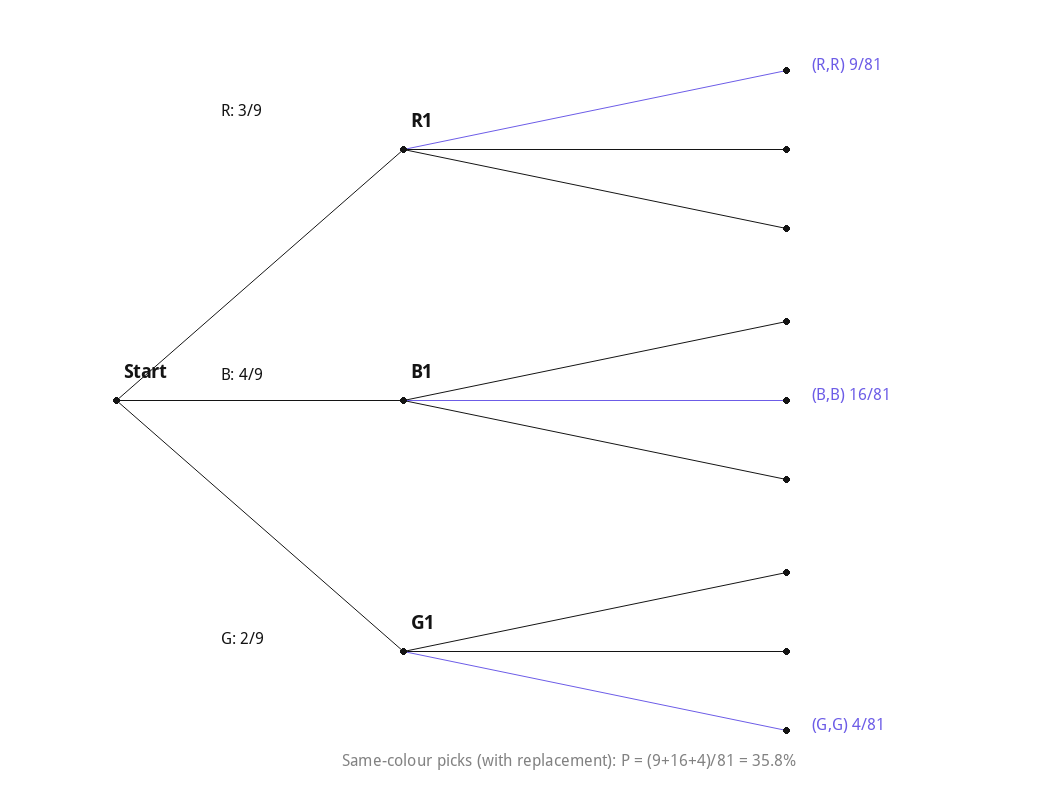
Quick visual: a worked diagram from the full Solutions page, for reference.
- Chapter 1: Orienting Yourself: The Use of Coordinates – Extra Questions with Answers
- Chapter 2: Introduction to Linear Polynomials – Extra Questions with Answers
- Chapter 3: The World of Numbers – Extra Questions with Answers
- Chapter 4: Exploring Algebraic Identities – Extra Questions with Answers
- Chapter 5: I'm Up and Down, and Round and Round – Extra Questions with Answers
- Chapter 6: Measuring Space: Perimeter and Area – Extra Questions with Answers
- Chapter 8: Predicting What Comes Next?: Exploring Sequences and Progressions – Extra Questions with Answers
Frequently Asked Questions
If a bag contains 3 red balls and 2 blue balls, what is the probability of randomly drawing a blue ball?
The probability is calculated by dividing the favourable outcomes, 2 blue balls, by the total possible outcomes, 5 balls in total, giving a probability of two-fifths for drawing a blue ball.
Why is the probability of any event always a number between 0 and 1?
A probability of 0 means an event is impossible and a probability of 1 means an event is certain, so any event that is possible but not guaranteed falls somewhere between these two extremes.
Chapter Quiz — Test Your Understanding
Class 9 Mathematics Chapter 7 – Solutions and Notes
For complete step-by-step answers and a quick summary, check the Class 9 Mathematics Chapter 7 Solutions and Class 9 Mathematics Chapter 7 Revision Notes.
See also: Chapter 1 | Chapter 2 | Chapter 3 | Chapter 4 | Chapter 5 | Chapter 6 | Chapter 7
Practice more: Chapter 1 | Chapter 2 | Chapter 3 | Chapter 4 | Chapter 5 | Chapter 6
Quick revision: Chapter 1 | Chapter 2 | Chapter 3 | Chapter 4 | Chapter 5 | Chapter 6
Recommended: Buy the Printed NCERT Class 9 Maths Book
Contains Amazon affiliate links.
If you’d like a printed copy alongside the PDF, here’s a verified option:
4.0 out of 5 stars (1,313 ratings) · Rs. 106
Price and availability may change on Amazon. As an Amazon Associate, ncertbooks.org earns from qualifying purchases.